Setting up your first project
- Setting up the project
- Adding your elements
- Adding indicators
- Setting targets
- Recording your first result
Torch provides teams with all of the flexibility required to setup projects of any type. Each project has a unique structure, user access control model, and other advanced features. This section will guide you through the process of setting up your first project.
Creating a new project
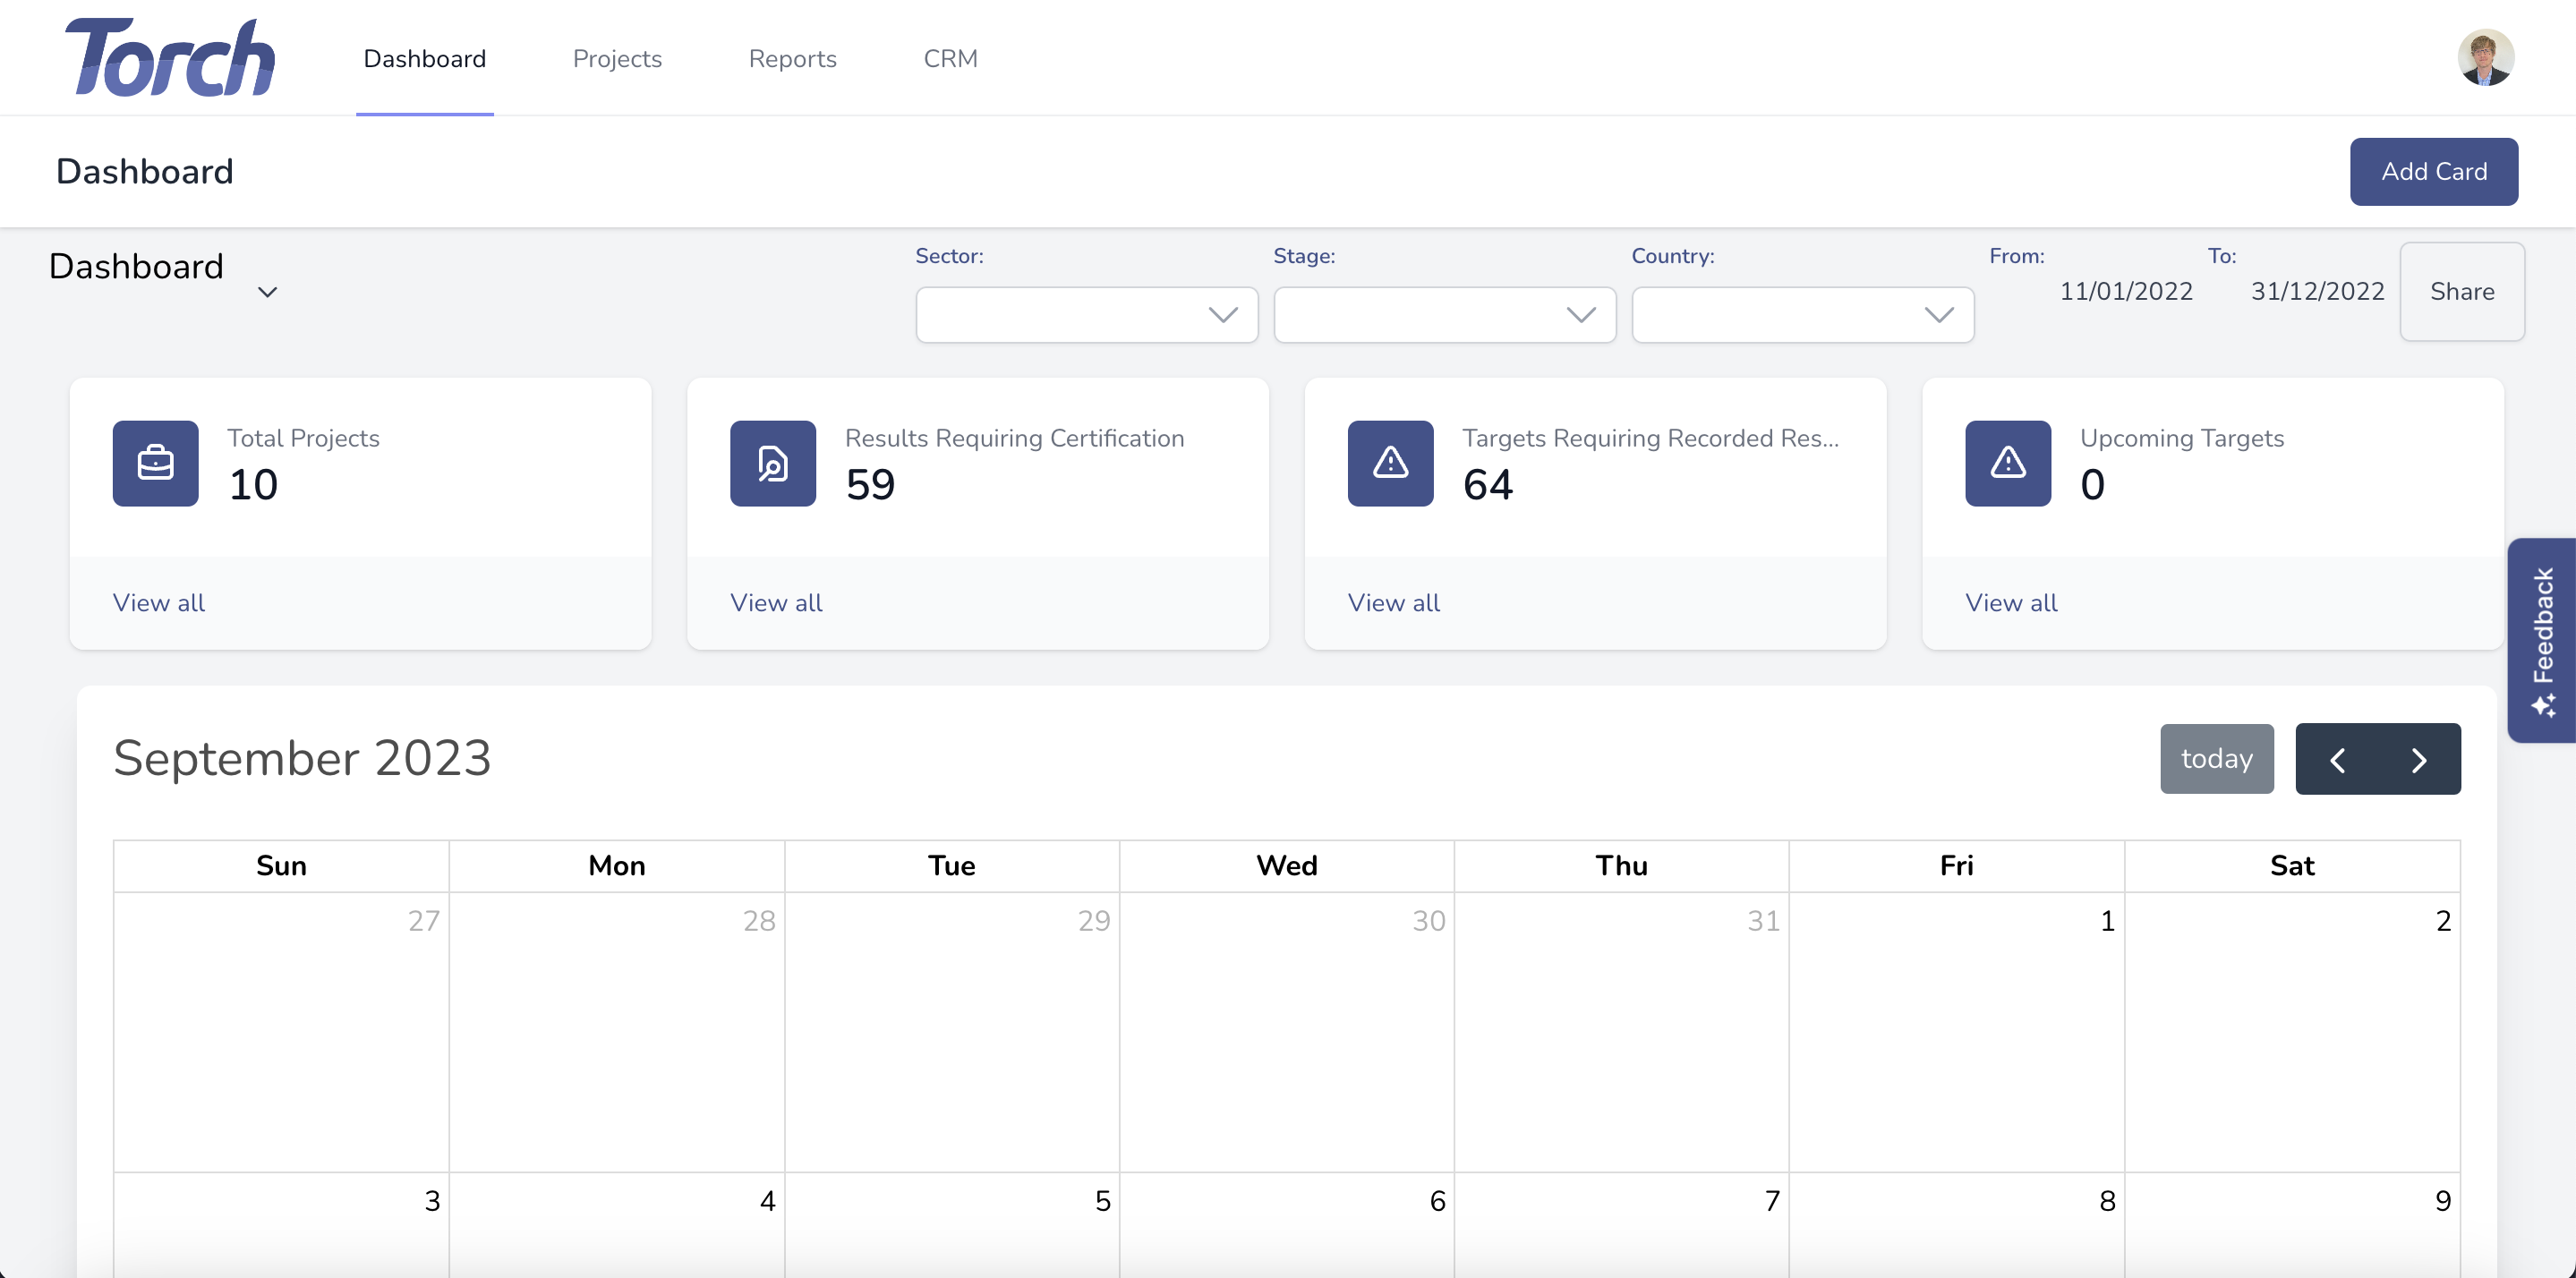
Step 1: From the top navigation bar click Projects.
Step 2: Click Create Project, and select Blank Project.
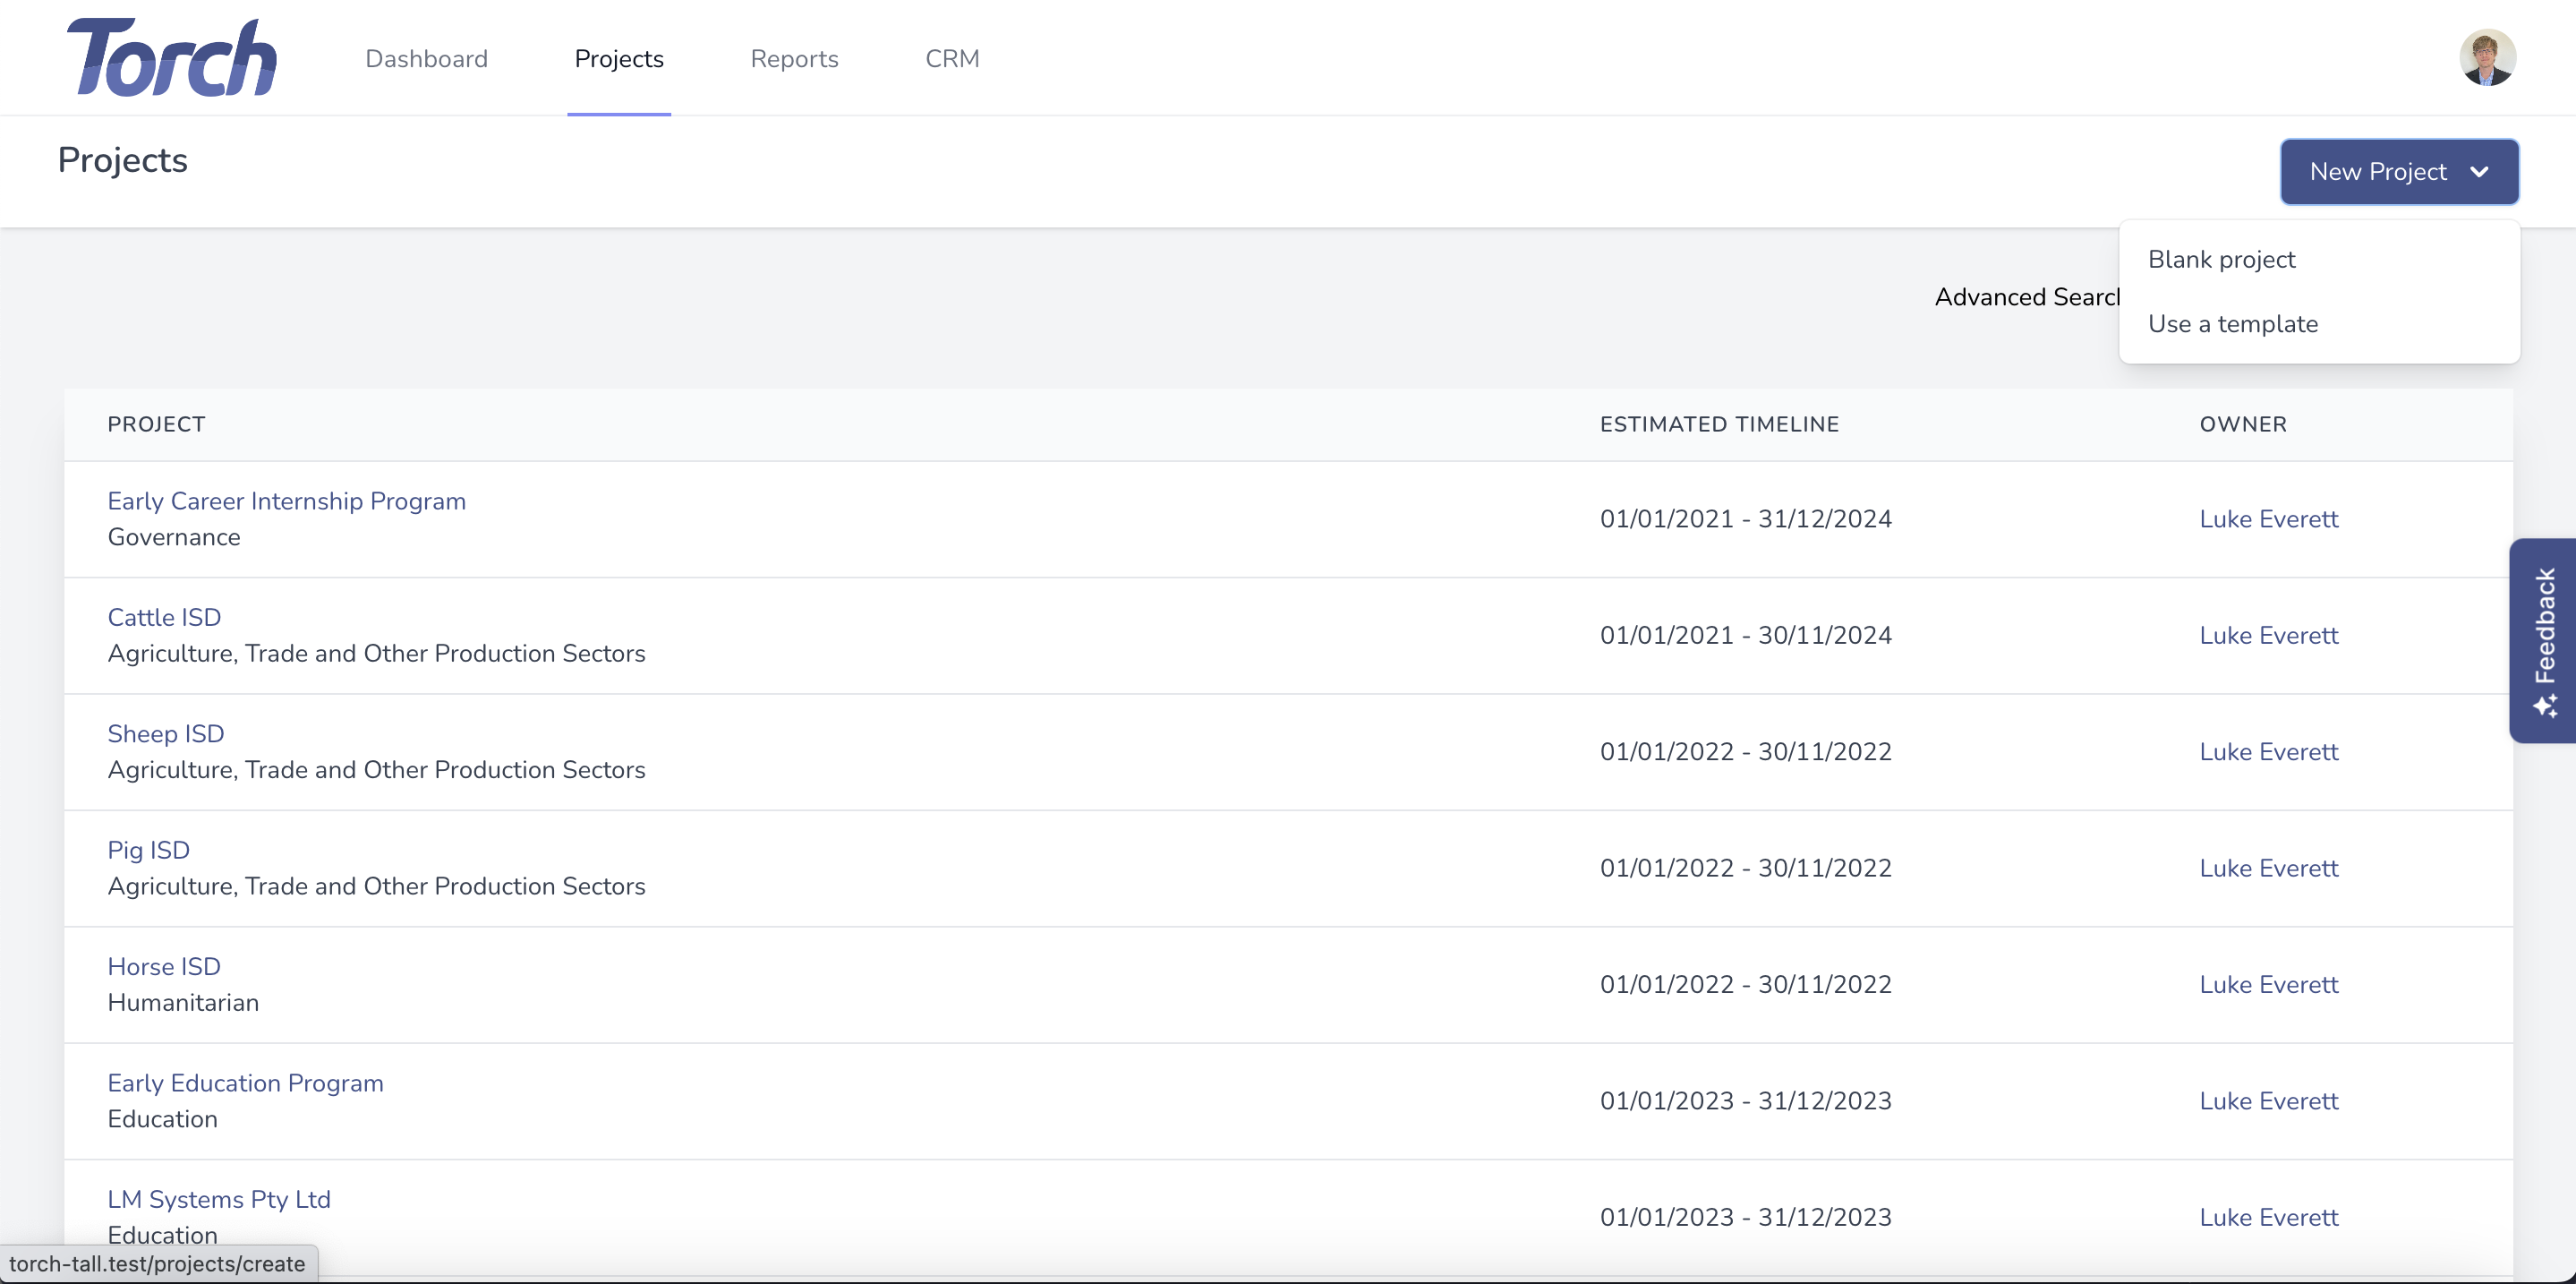
{primary} Torch has a number of best practice templates to help teams quickly get started when using specific approaches such as the Theory of Change approach or when building Logical Frameworks. Teams can also configure organisational templates for customised approaches. For this example we will configure a blank project.
Step 3: Fill out the new project form with the relevant information.
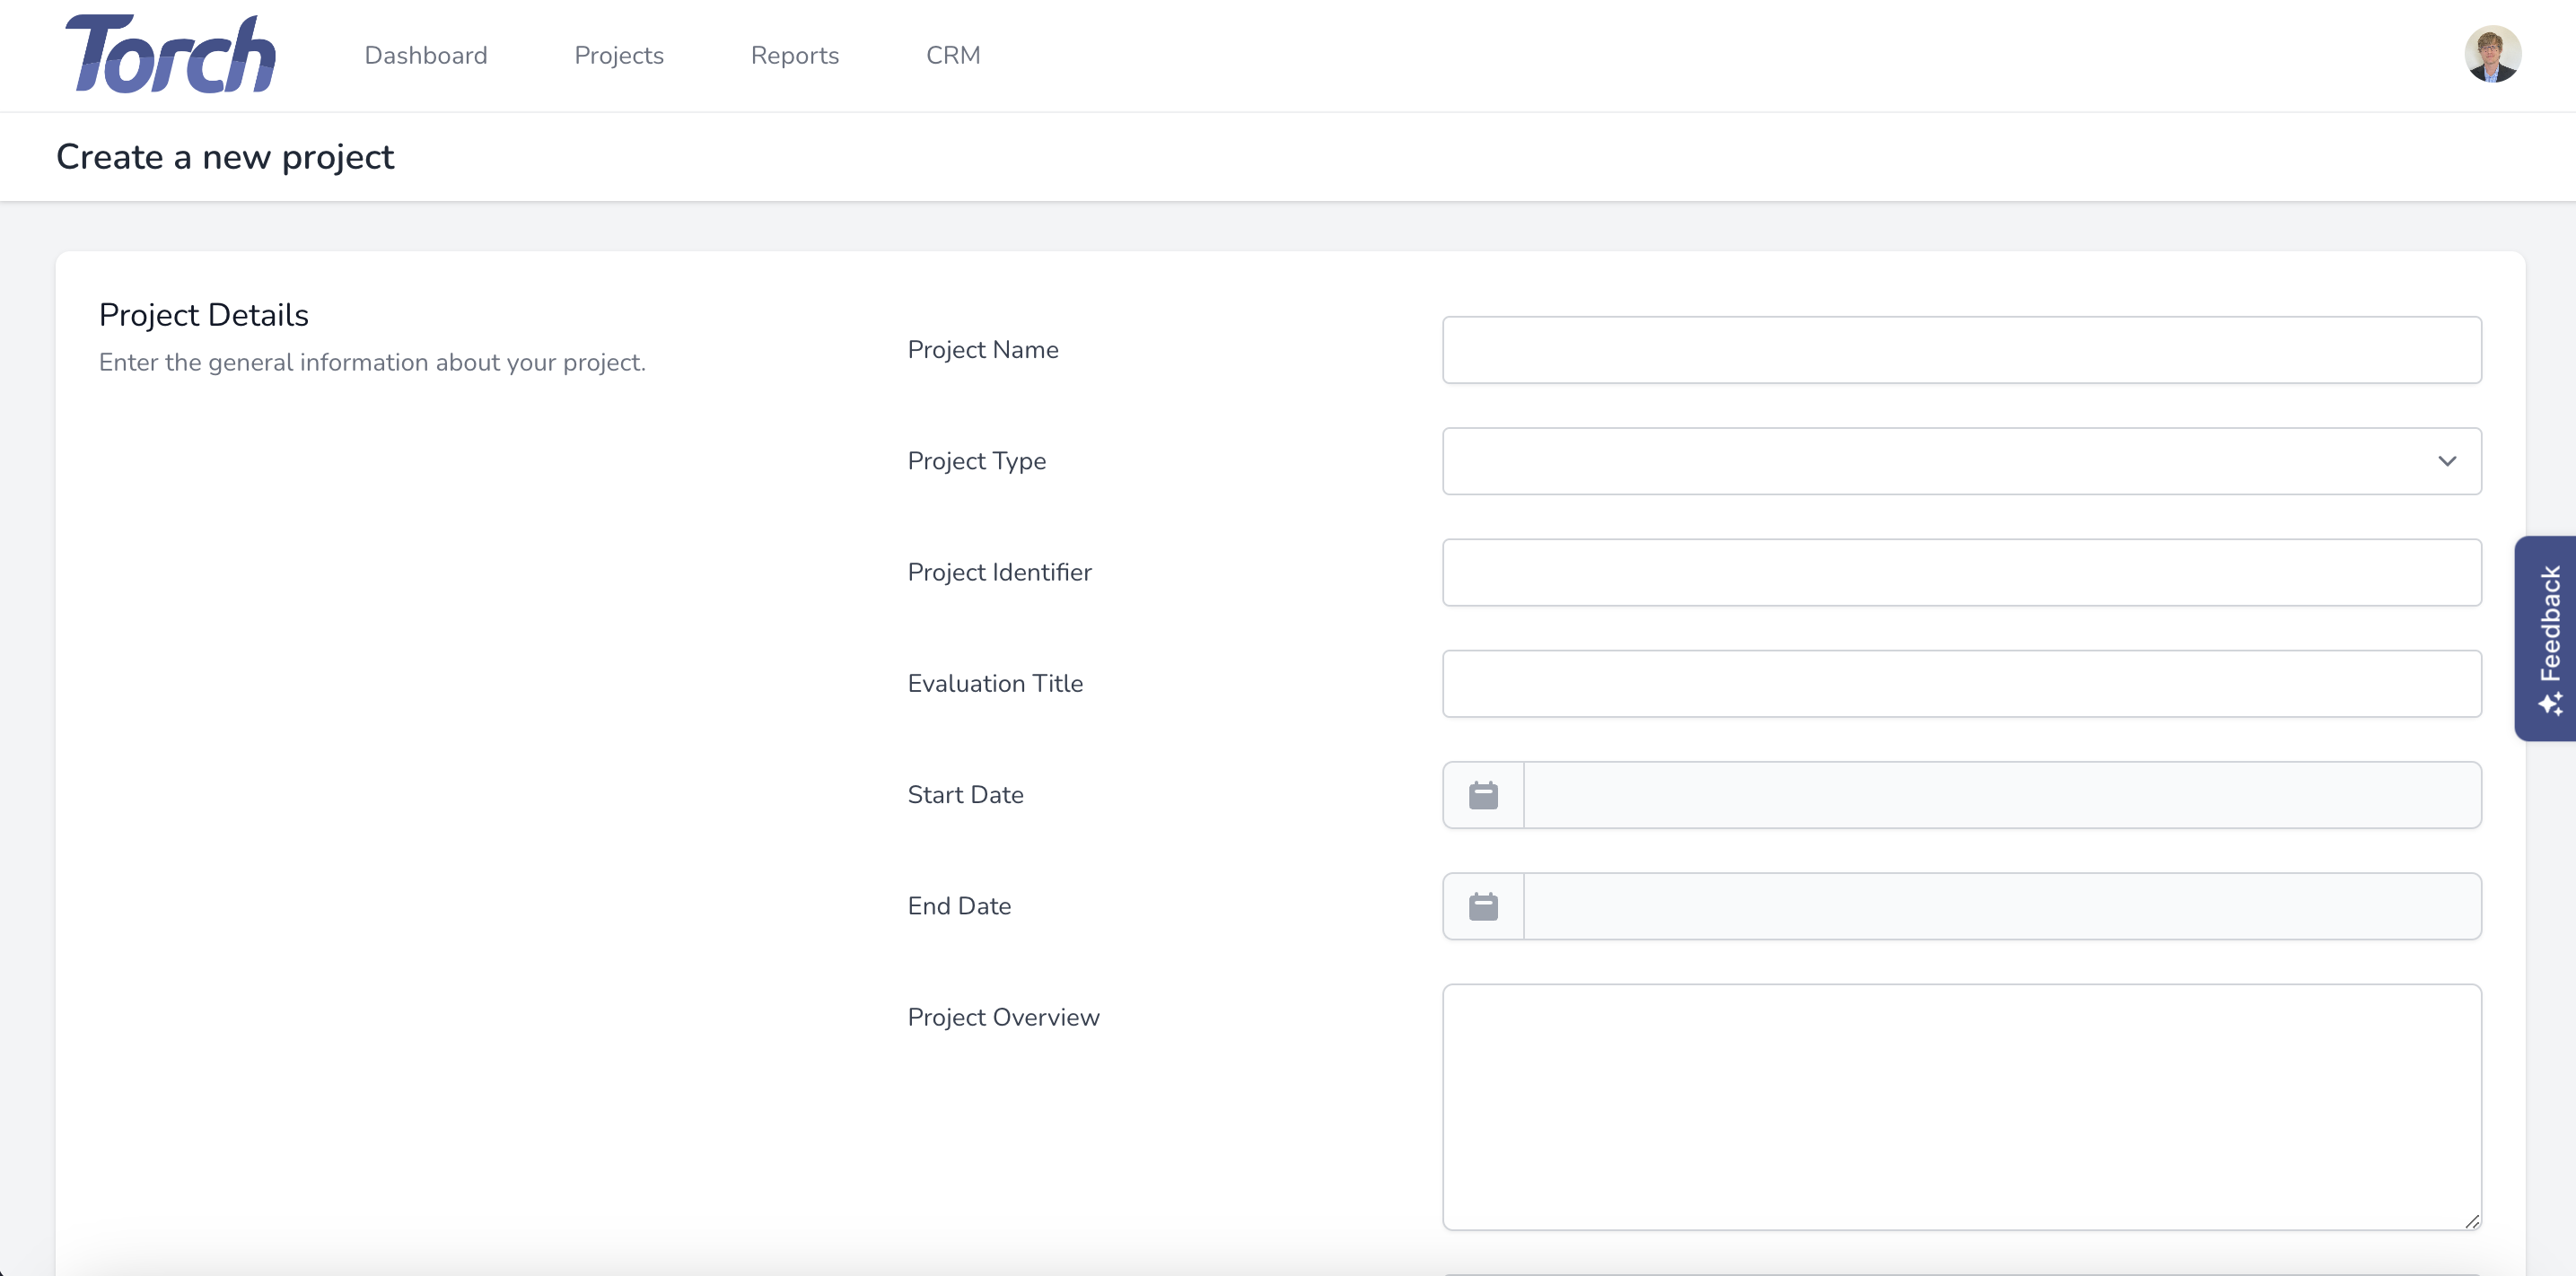
- Project Name: The name used to explain the project internally and externally.
- Project Type: These sectors can be used to filter dashboard visualisations. Types/Sectors can be updated in the Manage Tenant section.
- Project Identifier: An identifier can be used to link data not found in Torch with Torch specific data. This is relevant when using PowerBI or other visualisation platforms.
- Evaluation Title: This will appear in the side navigation of the project area. Generally recorded as Theory of Change, Program Logic, Impact Model, etc.
- Start Date: The start date of the project will control how visualisations are displayed.
- End Date: The end date of the project will control how visualisations are displayed.
- Project Overview: A brief overview will explain the project to external stakeholders and members of the team that might not be part of the evaluation team.
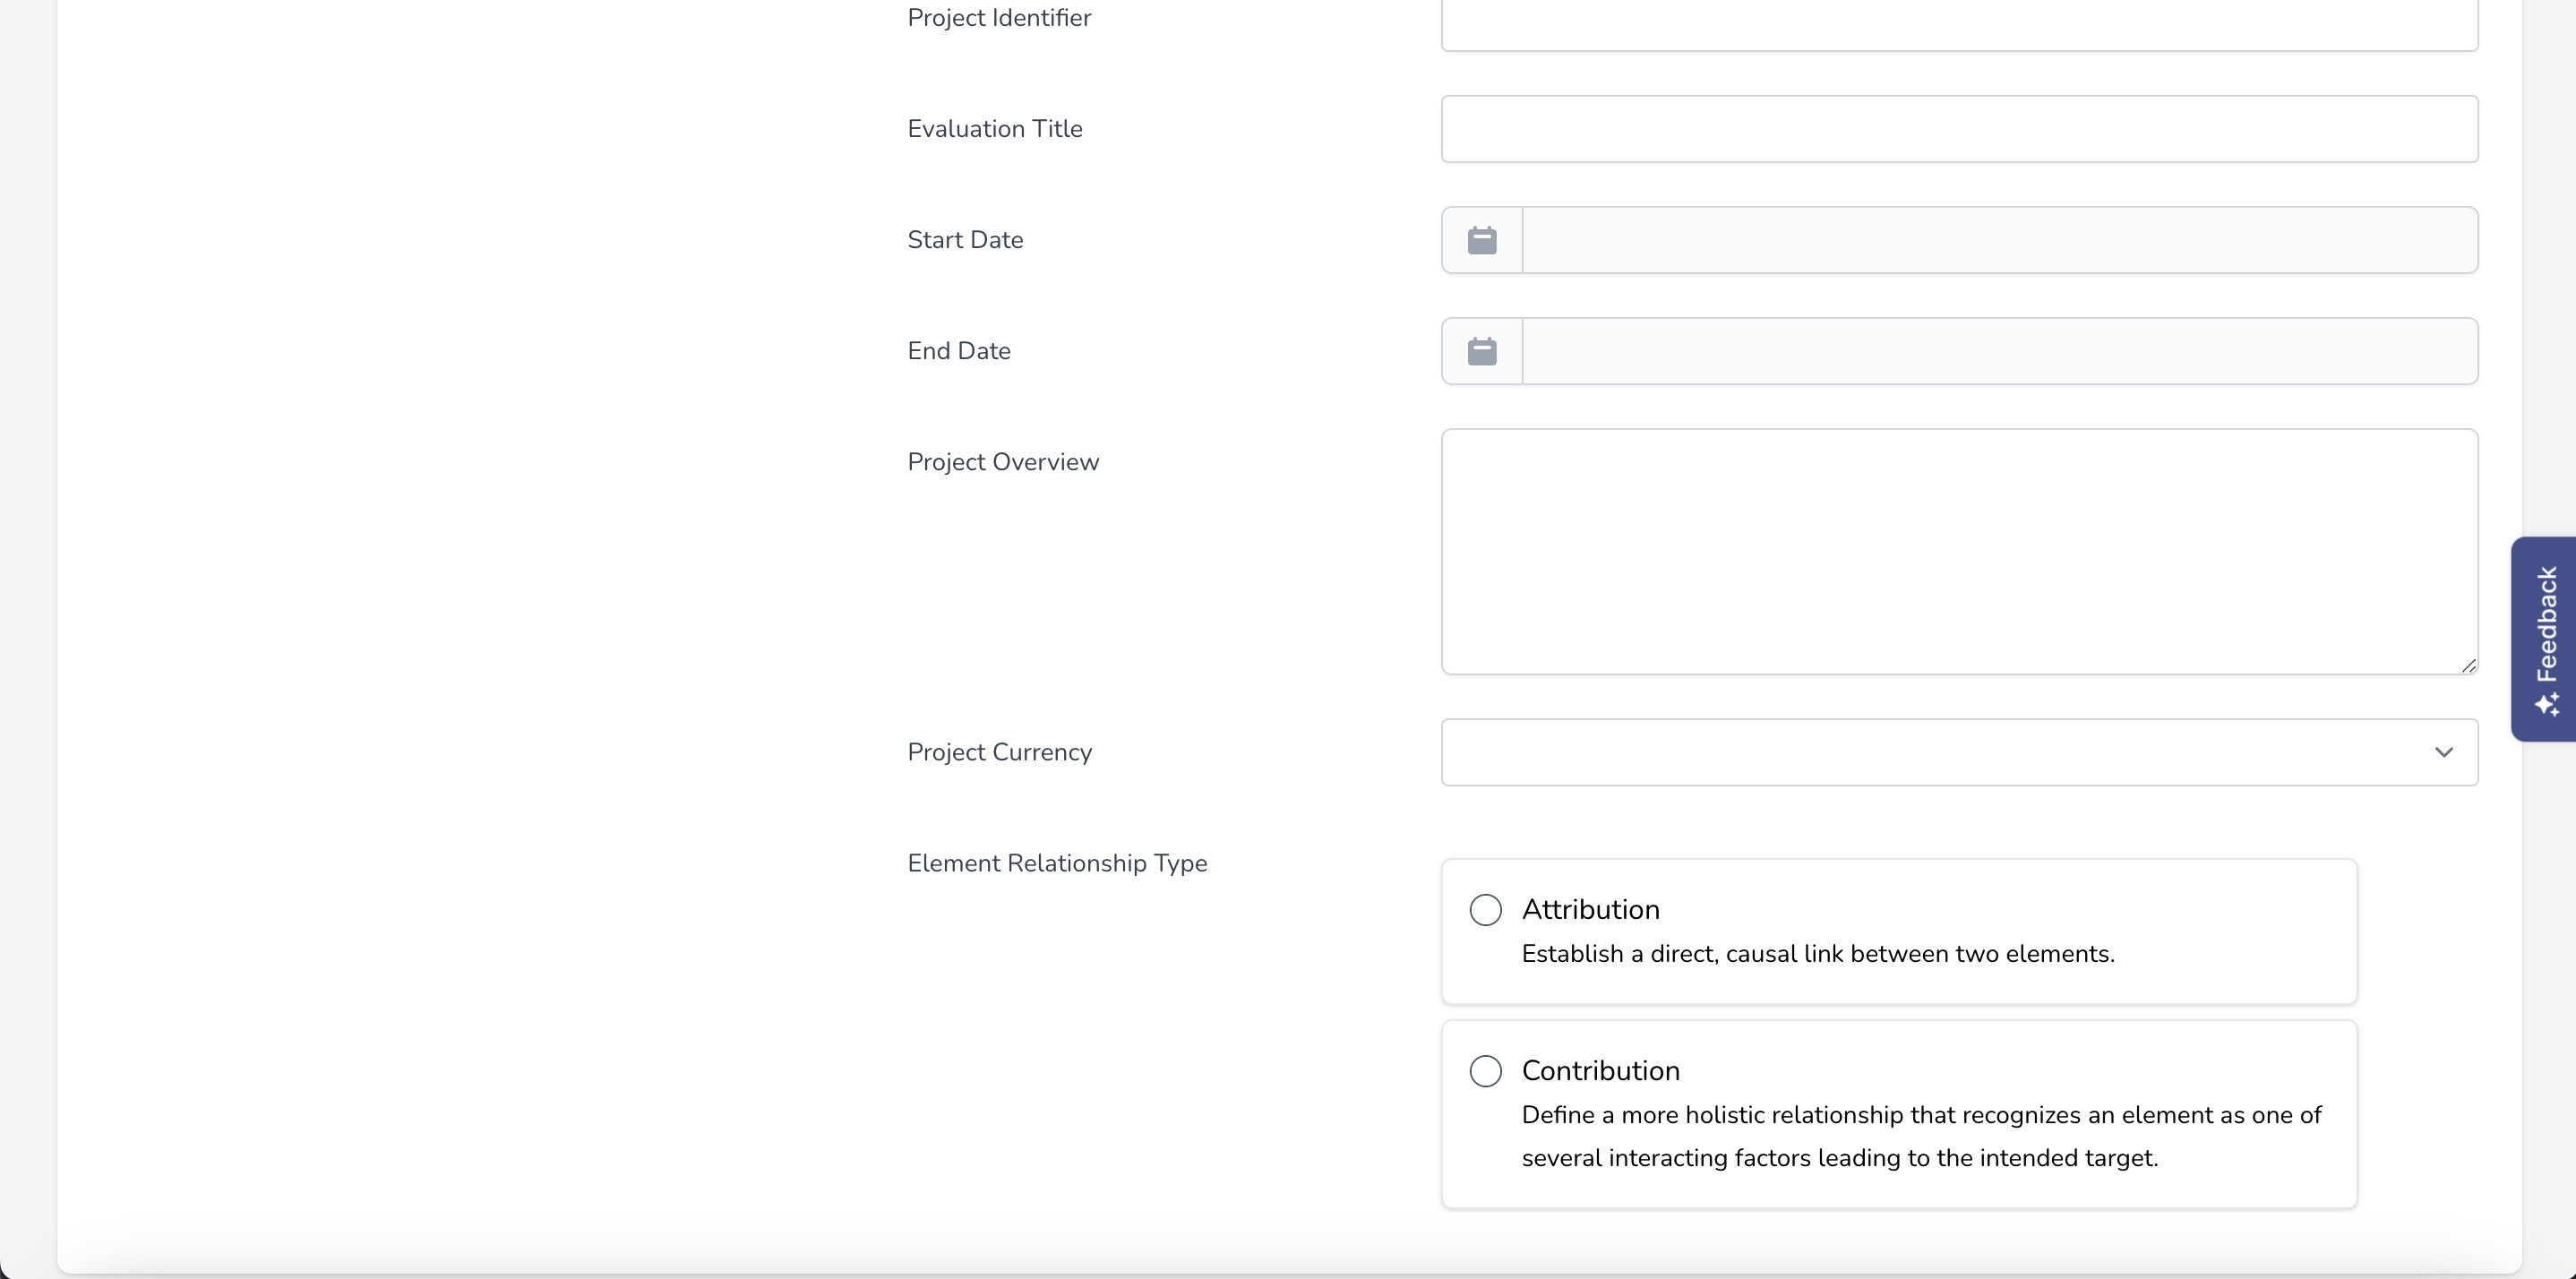
- Project Currency: Can be configured in the Manage Tenant section.
- Element Relationship Type: This field better explains the relationship between elements of your approach.
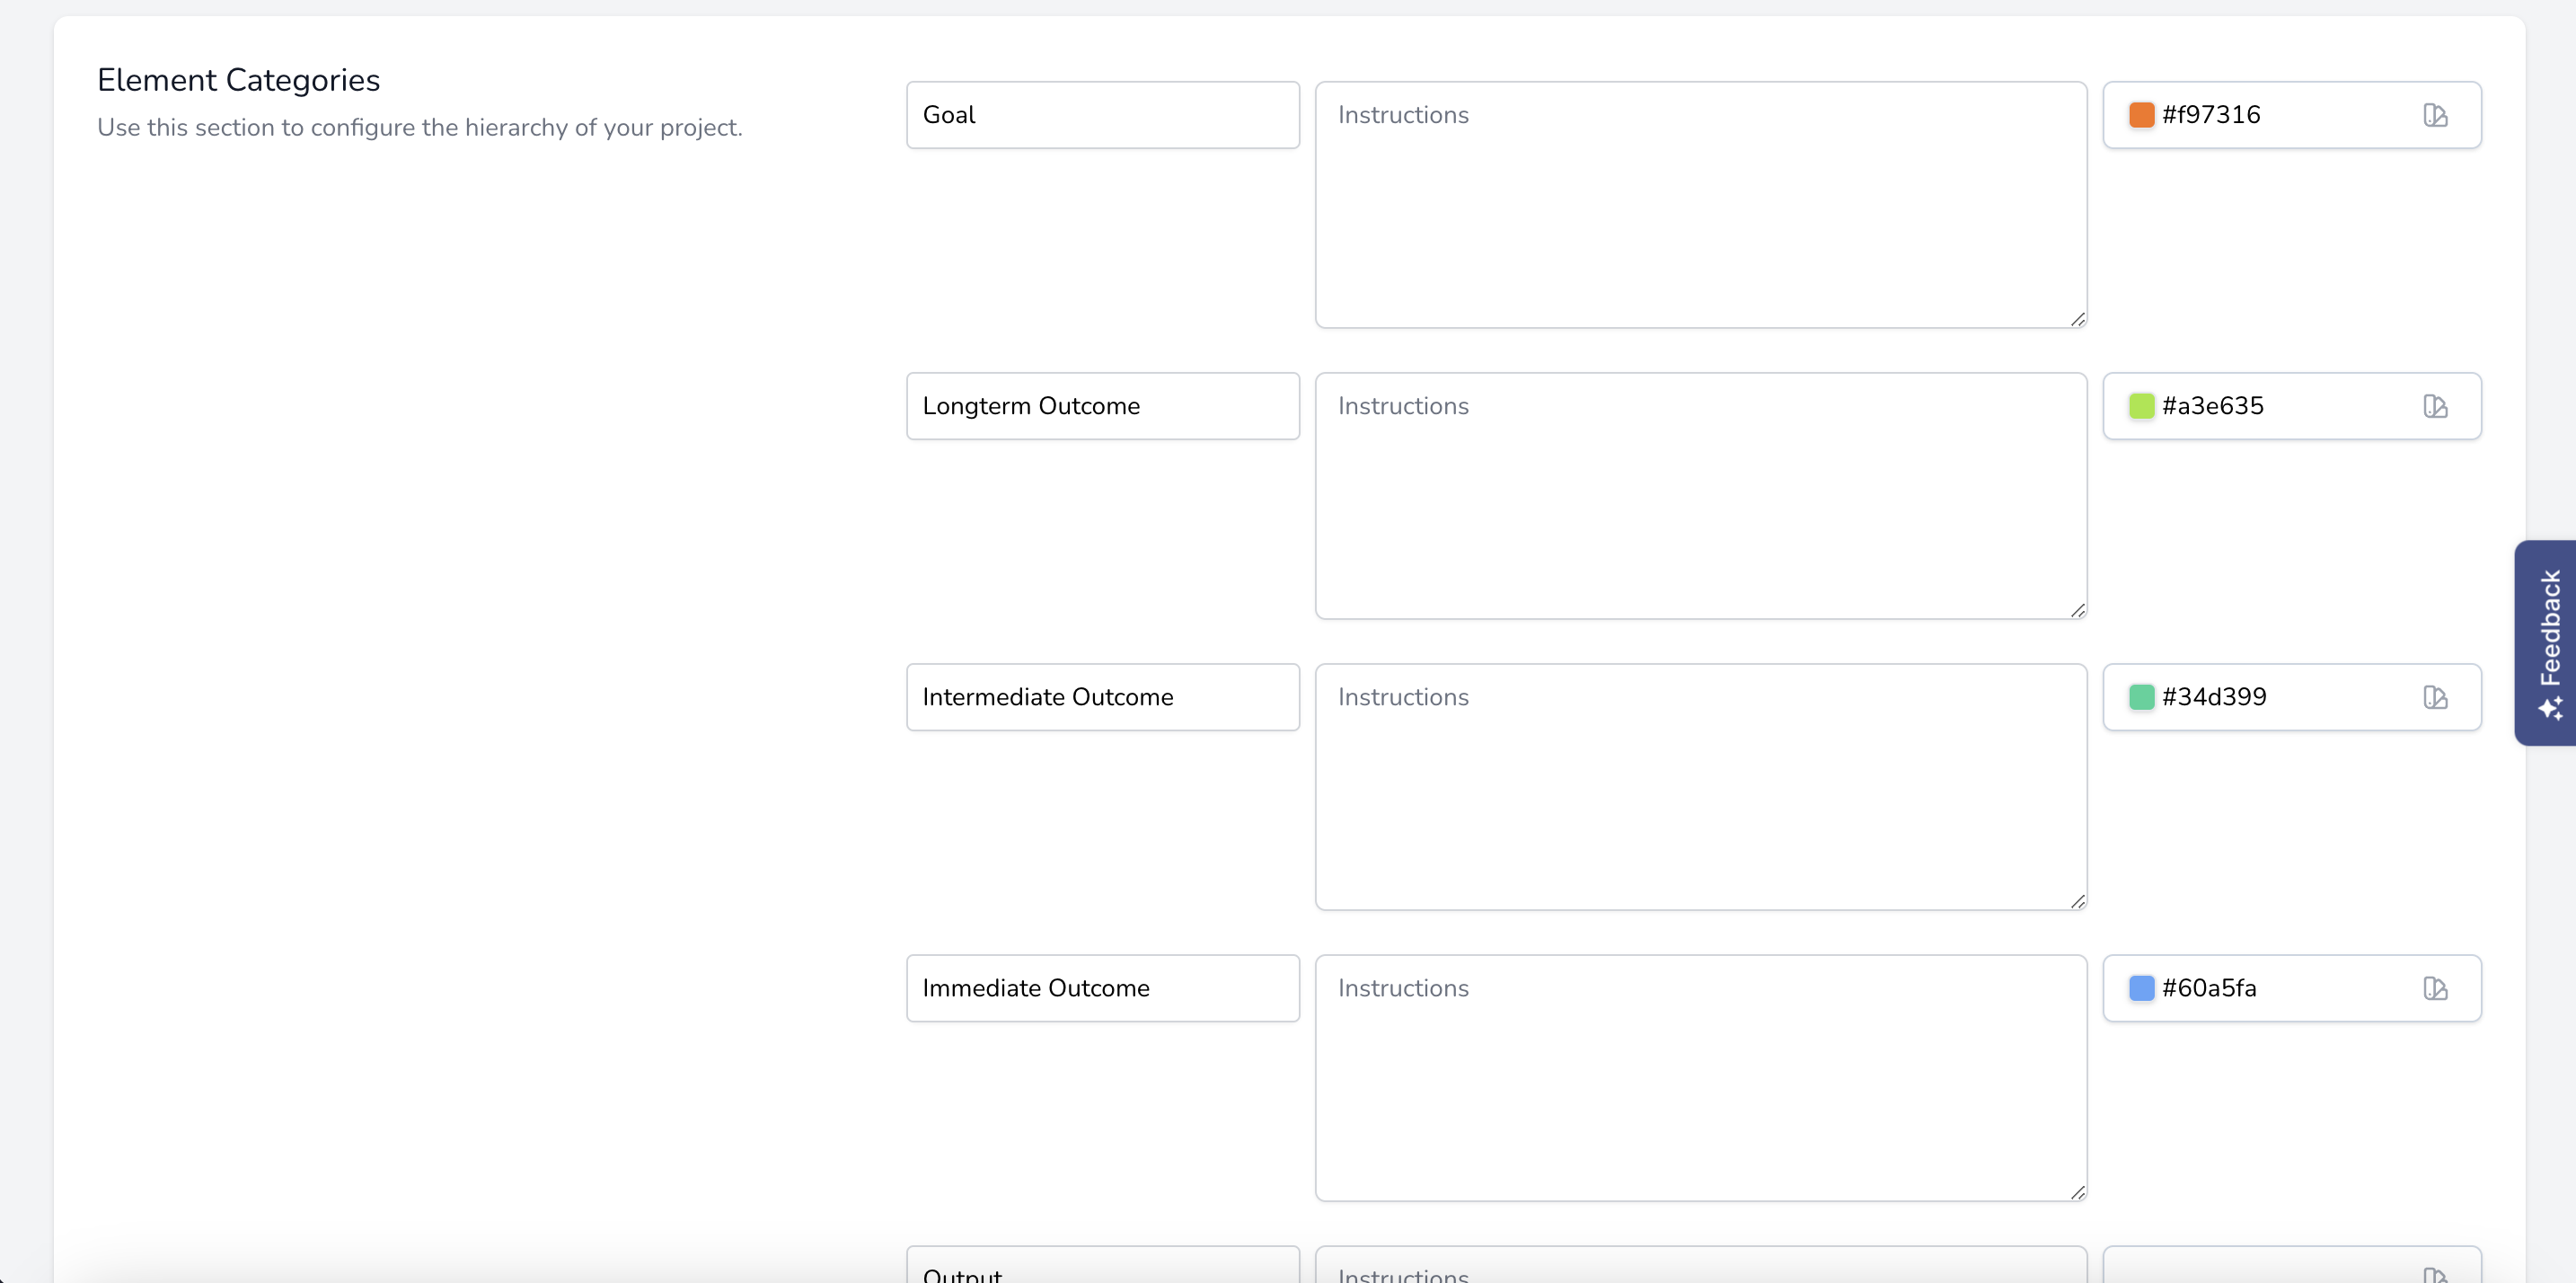
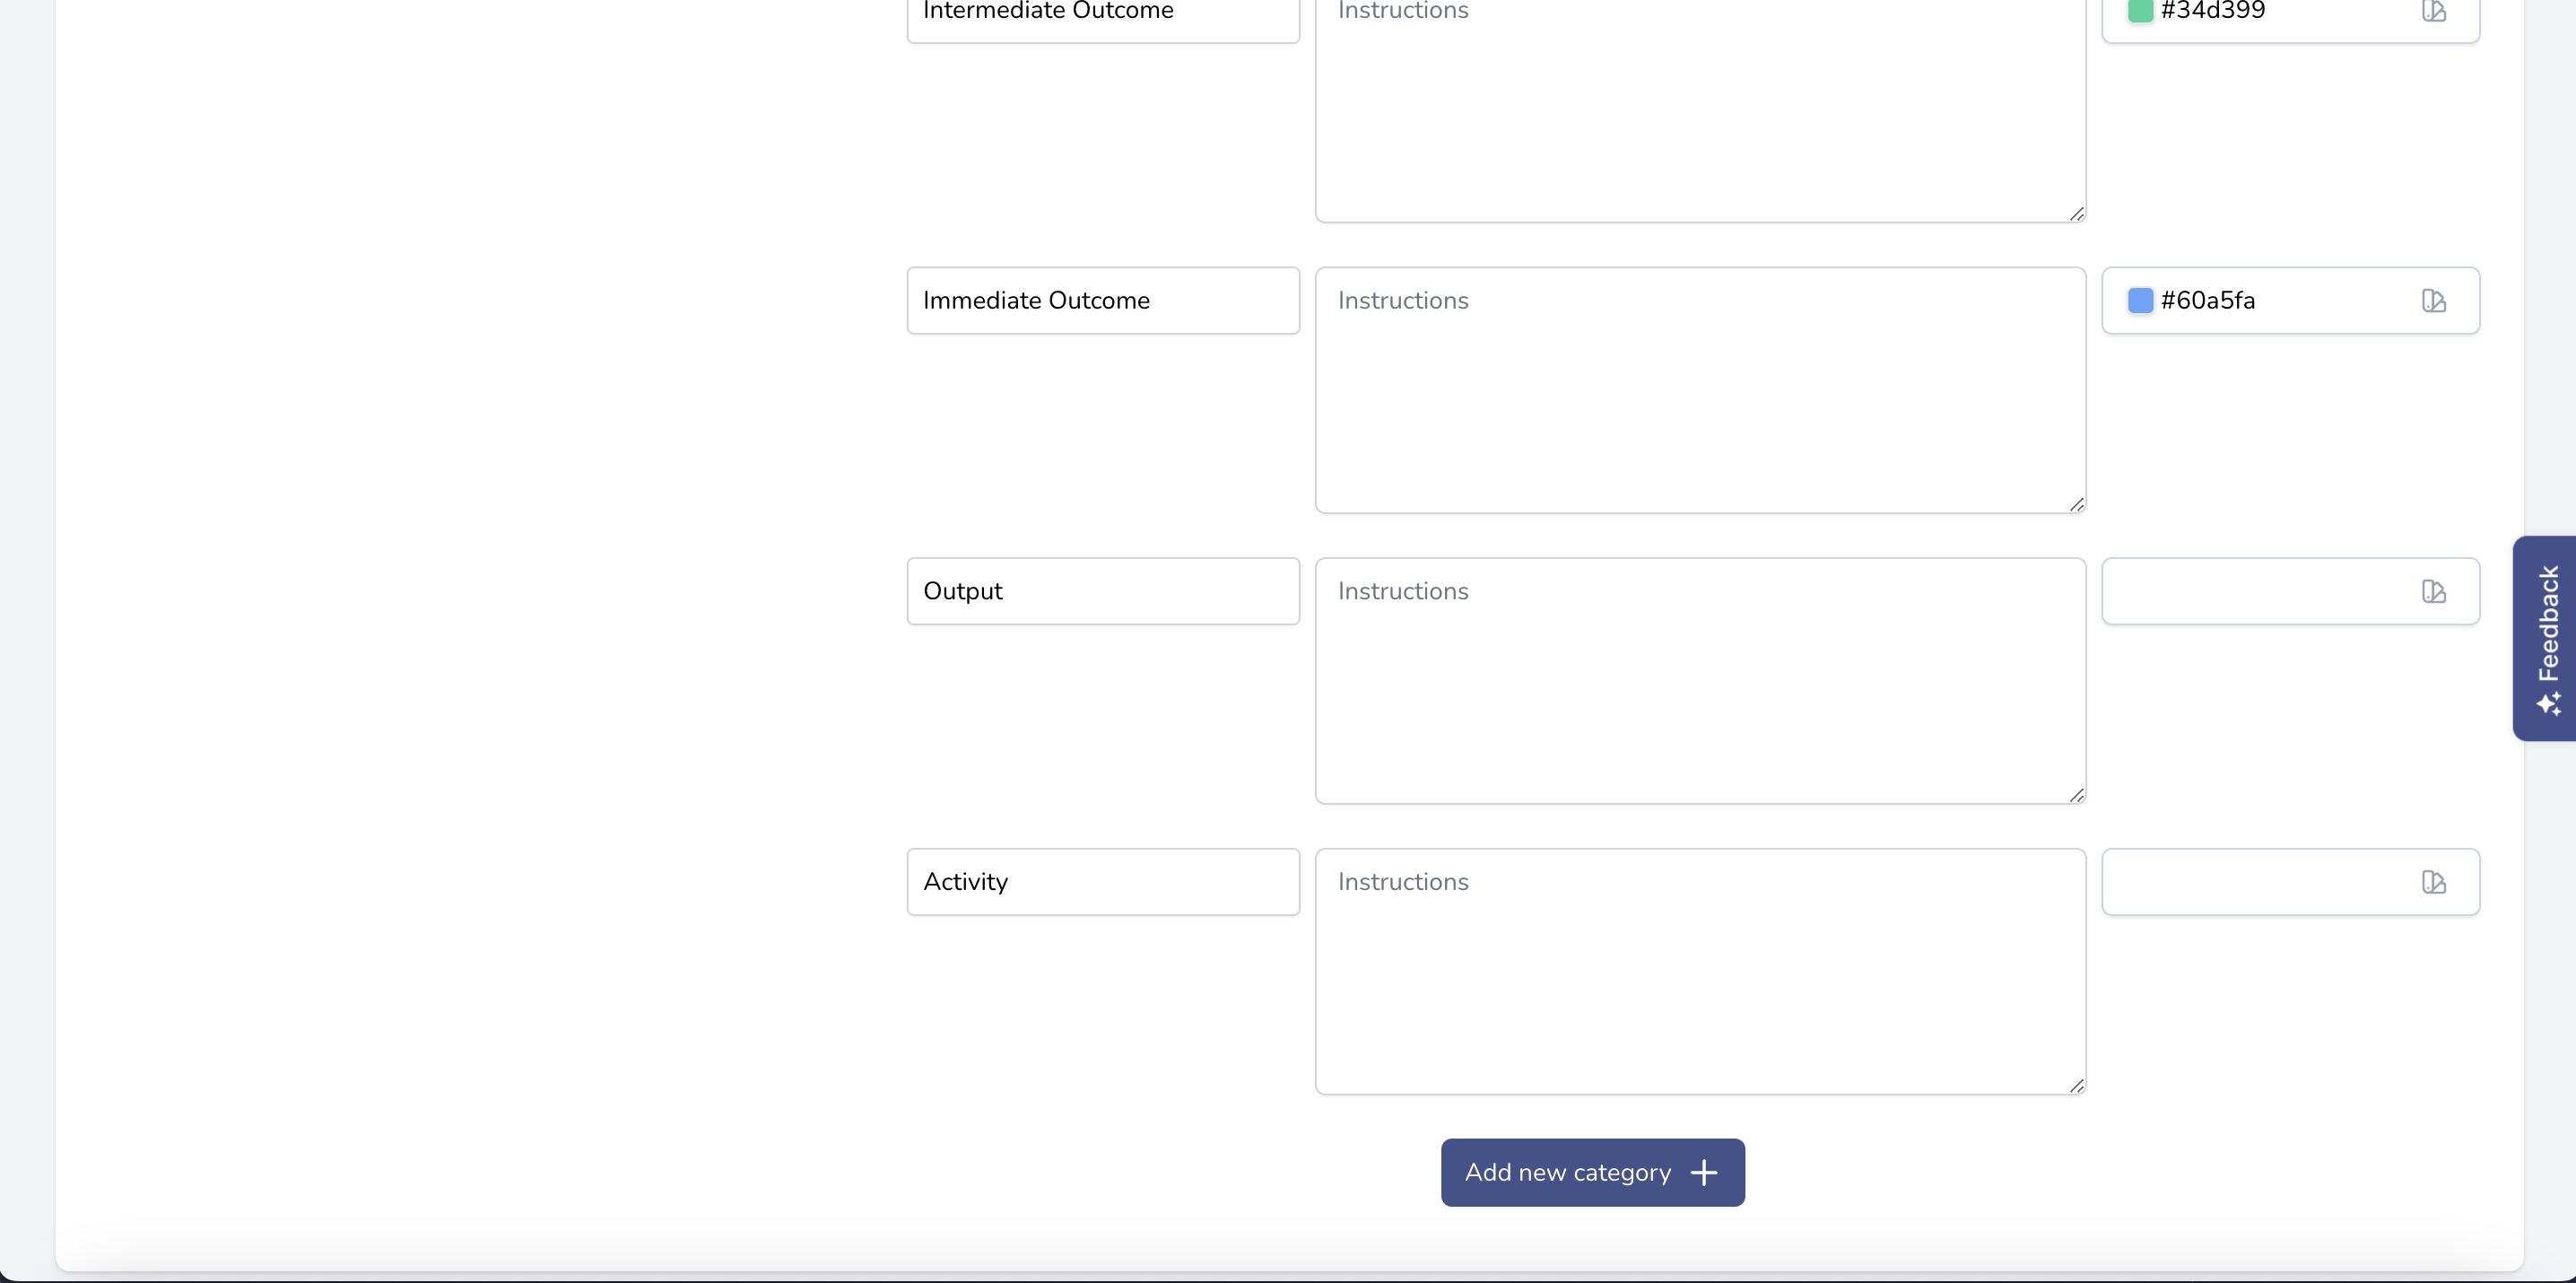
Step 4: Setup the heirarchy of your project.
Existing levels can be updated or deleted, and new levels added using the Add new category button. Each level can be colour coded for use in various diagram views.
Step 5: Click Submit.
Adding your elements
{primary} Torch provides two ways to add the elements for your approach, manually via the project home screen, or via the Wizard. In this example we will create them manually. See the Wizard guide in the features section for more information on the Wizard.
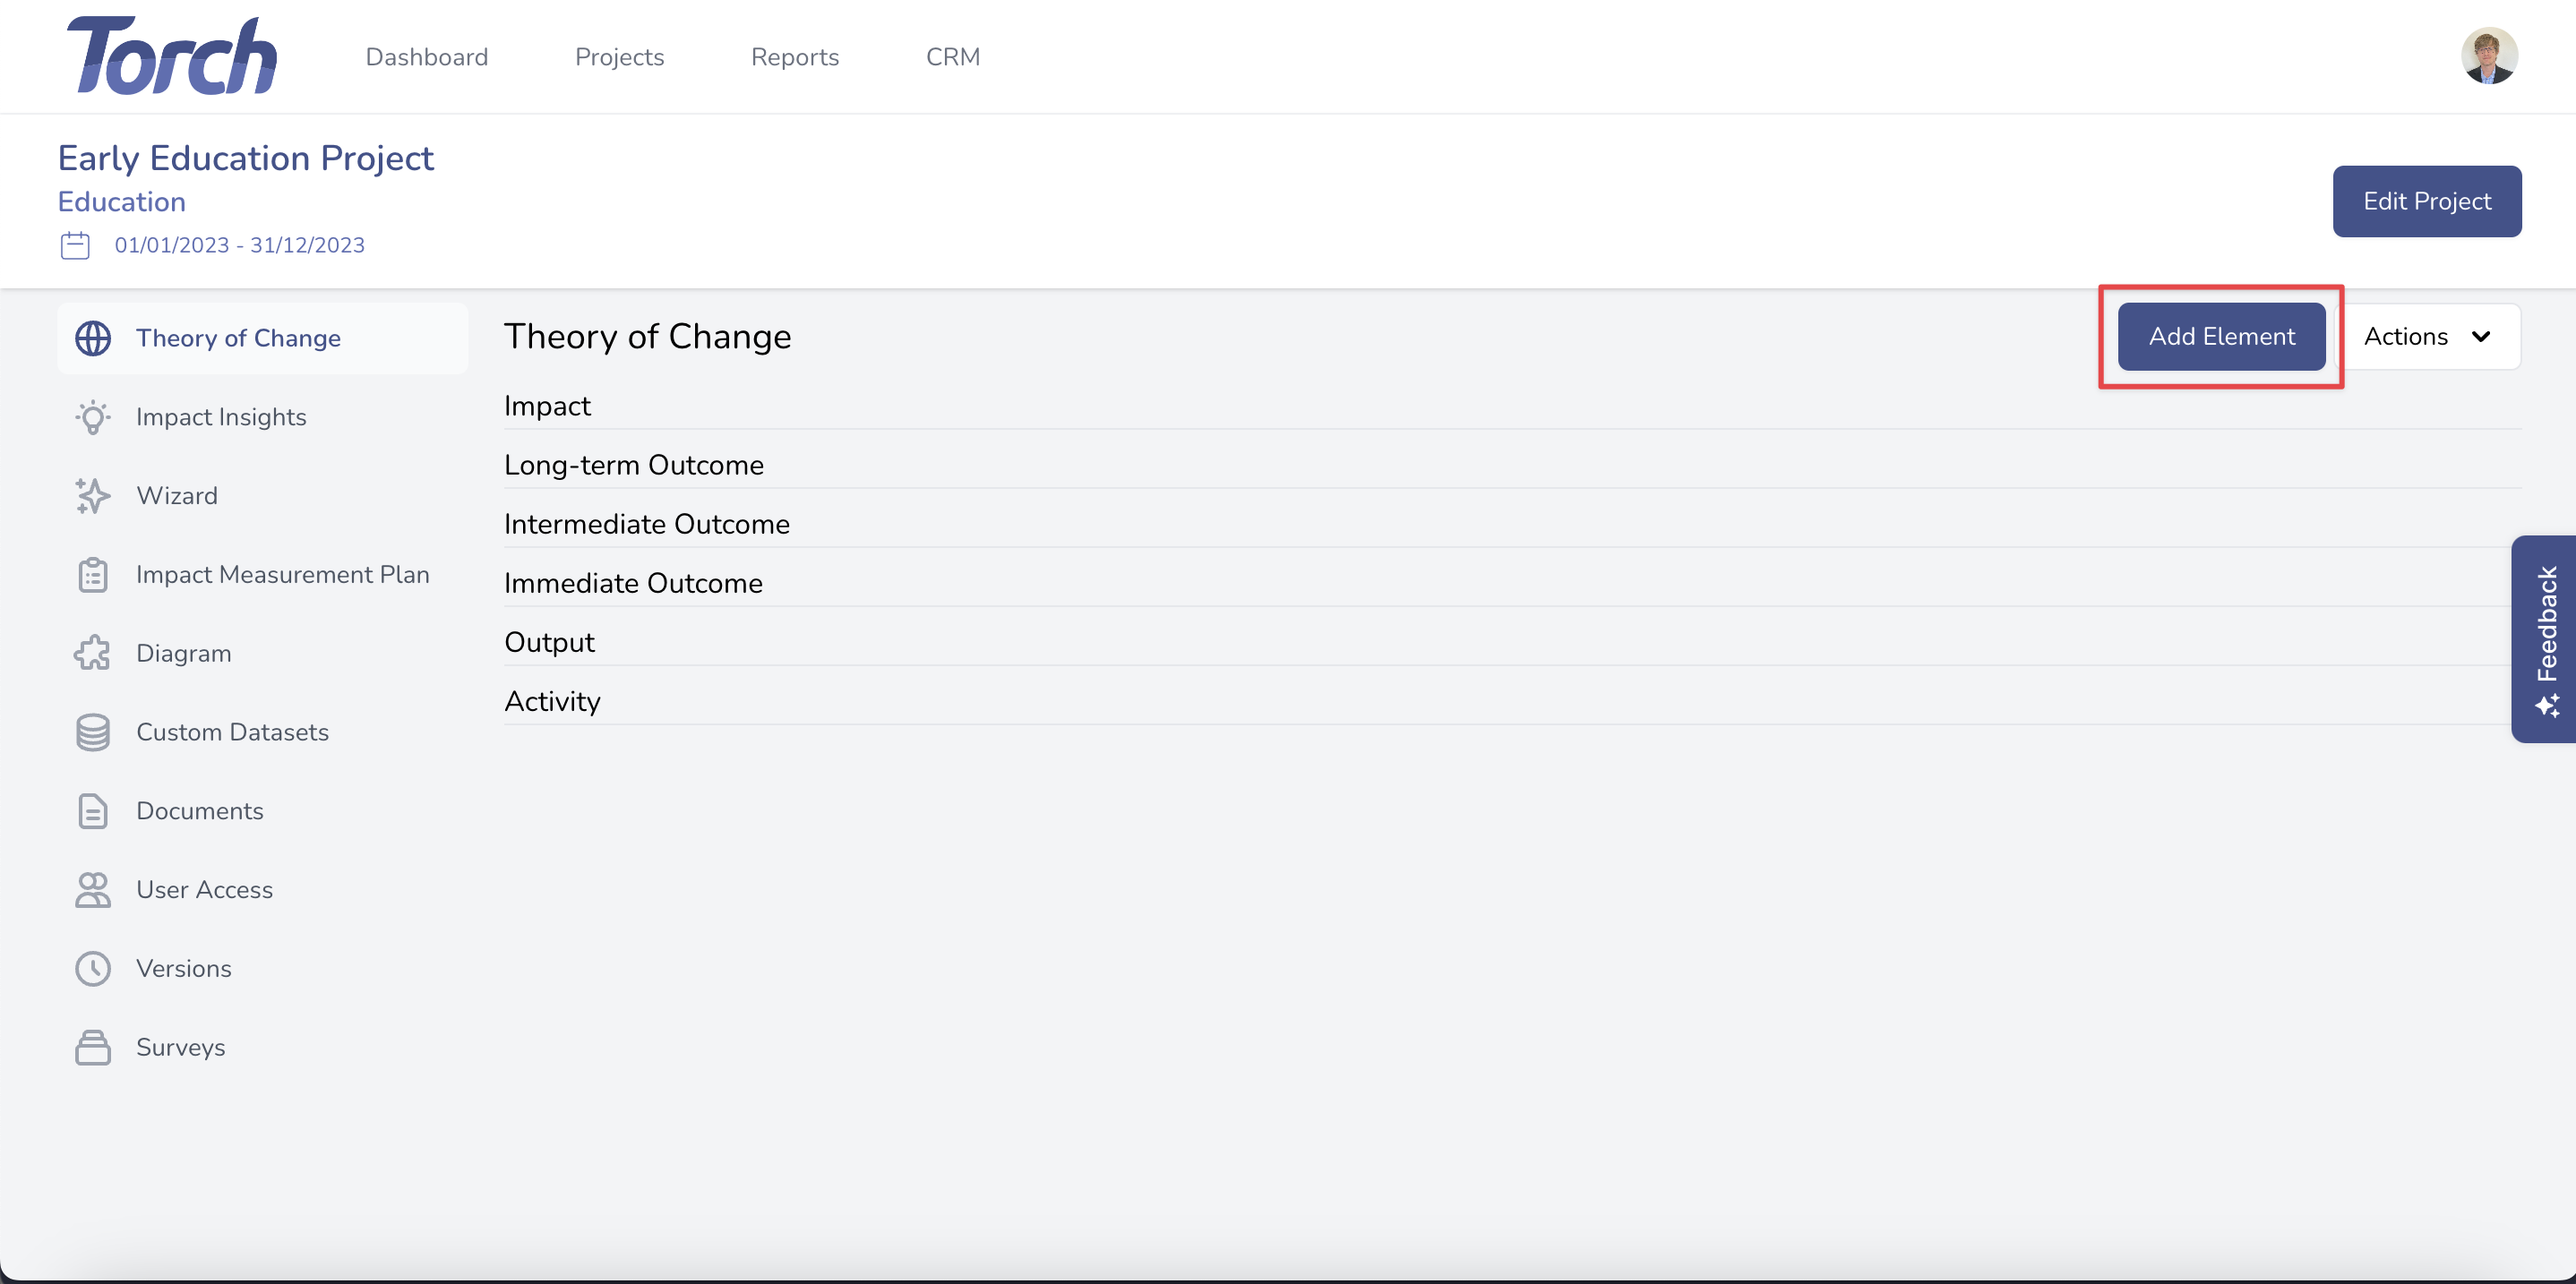
Step 1: From the project home screen click Add element.
Step 2: Fill out the form with the relevant information and click Create.
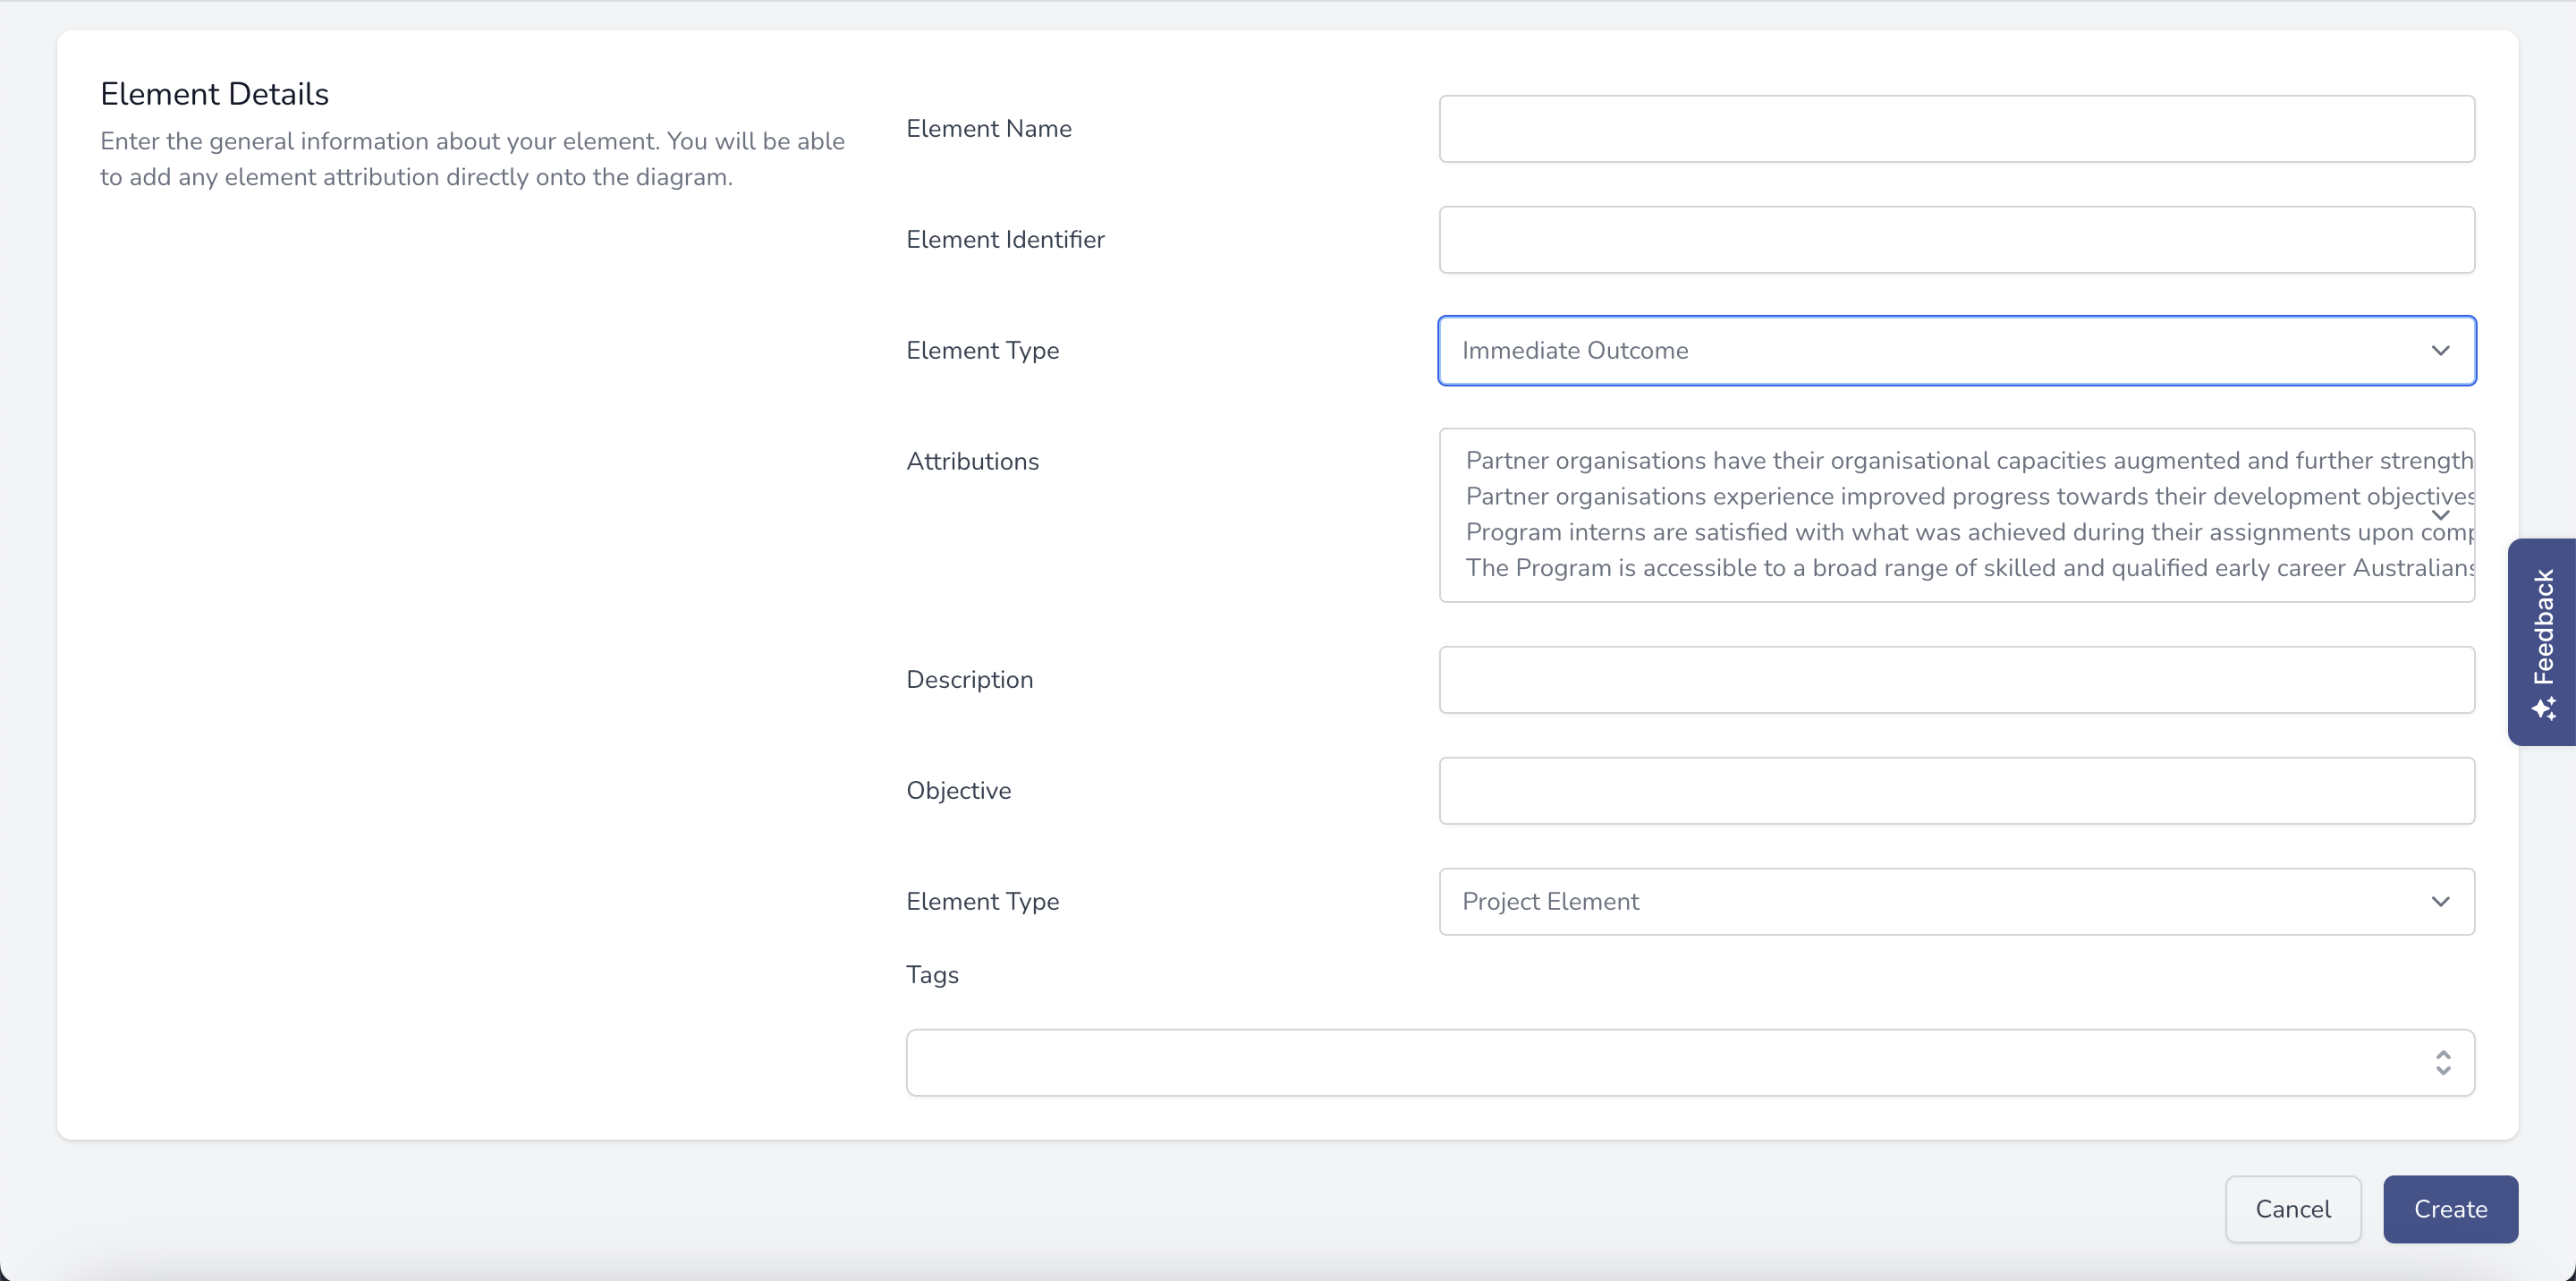
- Element Name: The name of the element. A good outline of what the element is trying to achieve.
- Element Identifier: This identifier can be used when linking elements in external BI platforms or as shorthand when talking about the approach.
- Element Type: This defines the level of the hierarchy where the element is located.
- Attributions: Select any elements in the level above this element to create a relationship between levels.
- Description: Explain the element in more detail so that everyone on your team can understand the element.
- Objective: Explain what the element is trying to achieve so that everyone can work towards the same goals.
- Element Classification: Sometimes you will want to track external factors within your approach and track external metrics. This will allow you to easily track external factors.
- Tags: Tags are at the heart of the Development Impact Graph. Tags allow you to logically group similar elements easily for future reporting.
Step 3: Complete step 2 as many times as required to completely define your approach.
Adding your Indicators
{primary} Indicators provide the basis for all measurement processes. Clear and concise indicators make it easy for teams to understand what needs to be measured, by when, and where measurements will be taken from. Torch also allows you to assign an indicator to a Team or Individual User to also track who is recording the measurements.
Step 1: Open the element that the new indicator will be attached to.
{primary} All indicators within Torch are related directly to an element so that it can be linked into the Development Impact Graph. This powers everything within Torch from the visualisations and reporting, through to the recommendation engine and benchmarking.
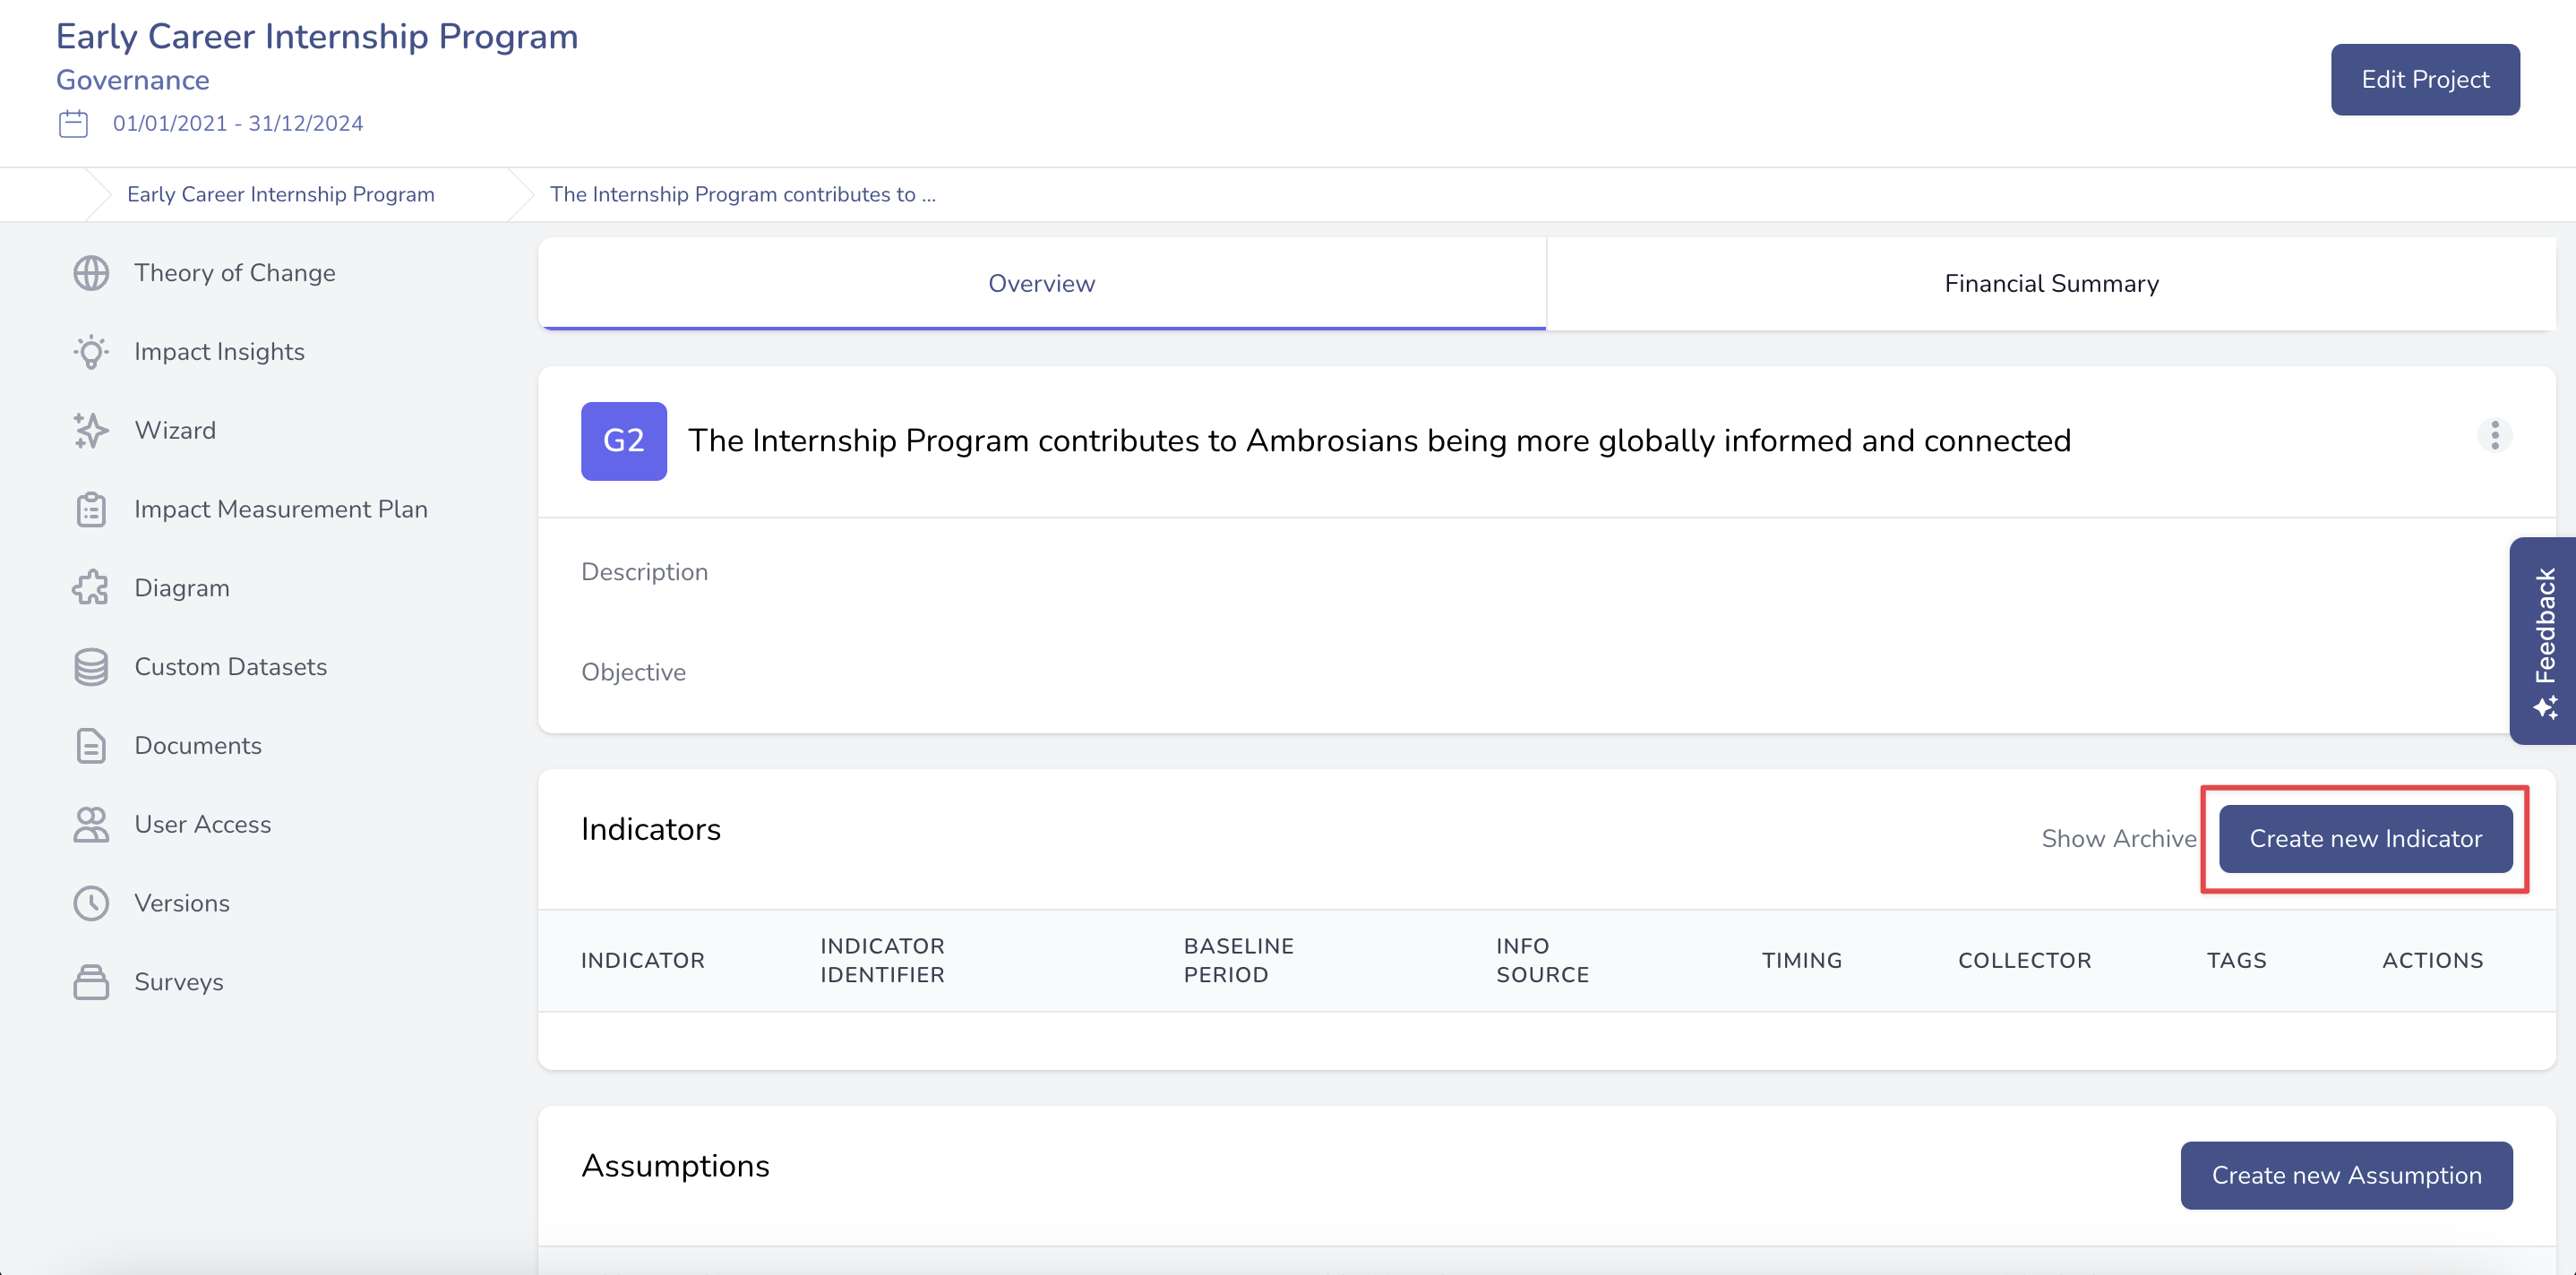
Step 2: Click Create new Indicator.
Step 3: Fill out the required fields to define your indicator.
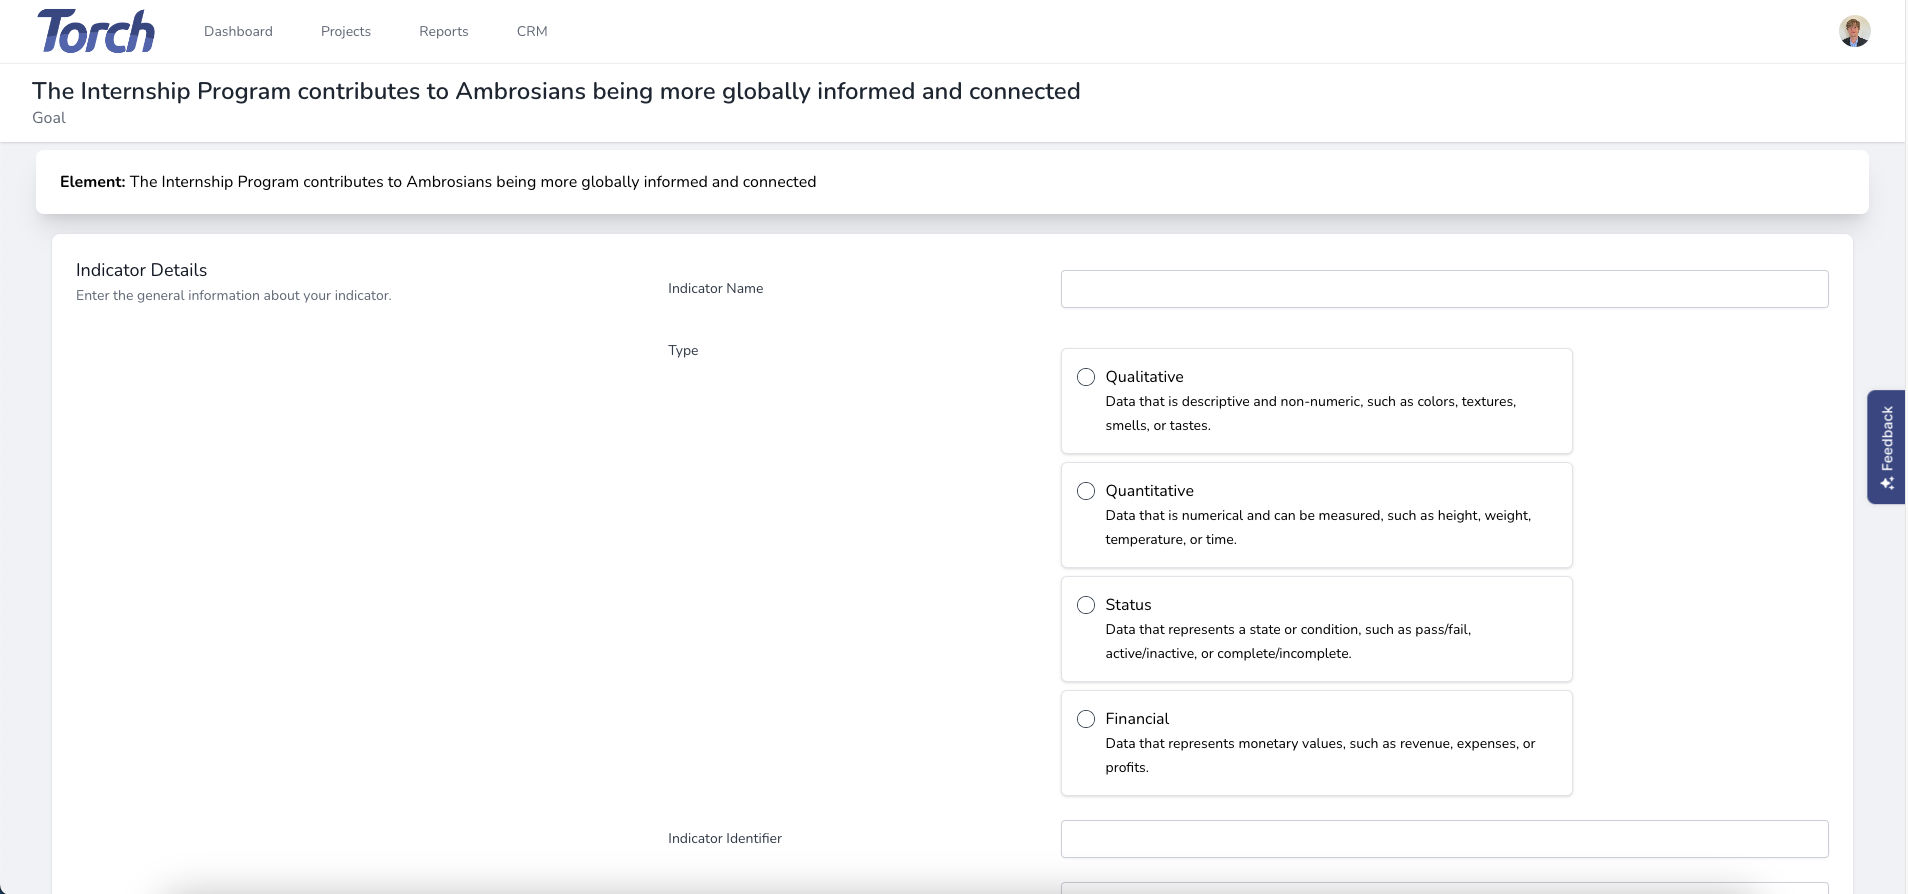
- Indicator Name: A clear indicator name will explain its purpose at a glance. Indicator names should be description, specific, concise, and relevant to the level of the element it is related to.
- Type: Select the relevant indicator type. This will control the type of data you can record against the indicator, and inform the way visualisations and reports will behave.
- Indicator Identifier: Useful for linking to external data sources.
- Baseline Period: When the baseline was established.
- Information Source: Where the data is being recorded from. E.g. Survey, Industry datasource, field reports etc.
- Collection Timing: Frequency that data is collected.
- Data Collector: Who will be recording the data.
- Description: Describe the indicator in more detail so that others can clearly understand the purpose of the indicator.
- Calculation Method: This describes how you will record data. It is most important for quantitative data so that Torch is able to correctly calculate results for a specific indicator. For more information see the boxes within the interface for examples.
- Unit of Measure: Relevant for quantitative indicators to explain what is being measured.
- Level of Ambition: Used by some teams to understand the level of work required to achieve results for a specific indicator.
- Tags: Tags are at the heart of the Development Impact Graph. Tags allow you to logically group similar indicators easily for future reporting.
Step 4: Setup relevant disaggregations.
{primary} Disaggregation categories are setup in the Manage Tenant section. This ensures consistency for reporting purposes.
Add as many disaggregation options as required. Setting up disaggregation options can be a time consuming process to get them right. Our support team can assist with any questions you may have.
Step 5: Rating and Status options will be inherited from the project default configuration. You will be able to edit them once the indicator is created, or to update the defaults, edit the project.
Step 6: Repeat steps 2-4 for all of the required indicators.
{primary} Once all of the indicators have been created you will be ready to setup targets and start recording results!
Setting up your first targets
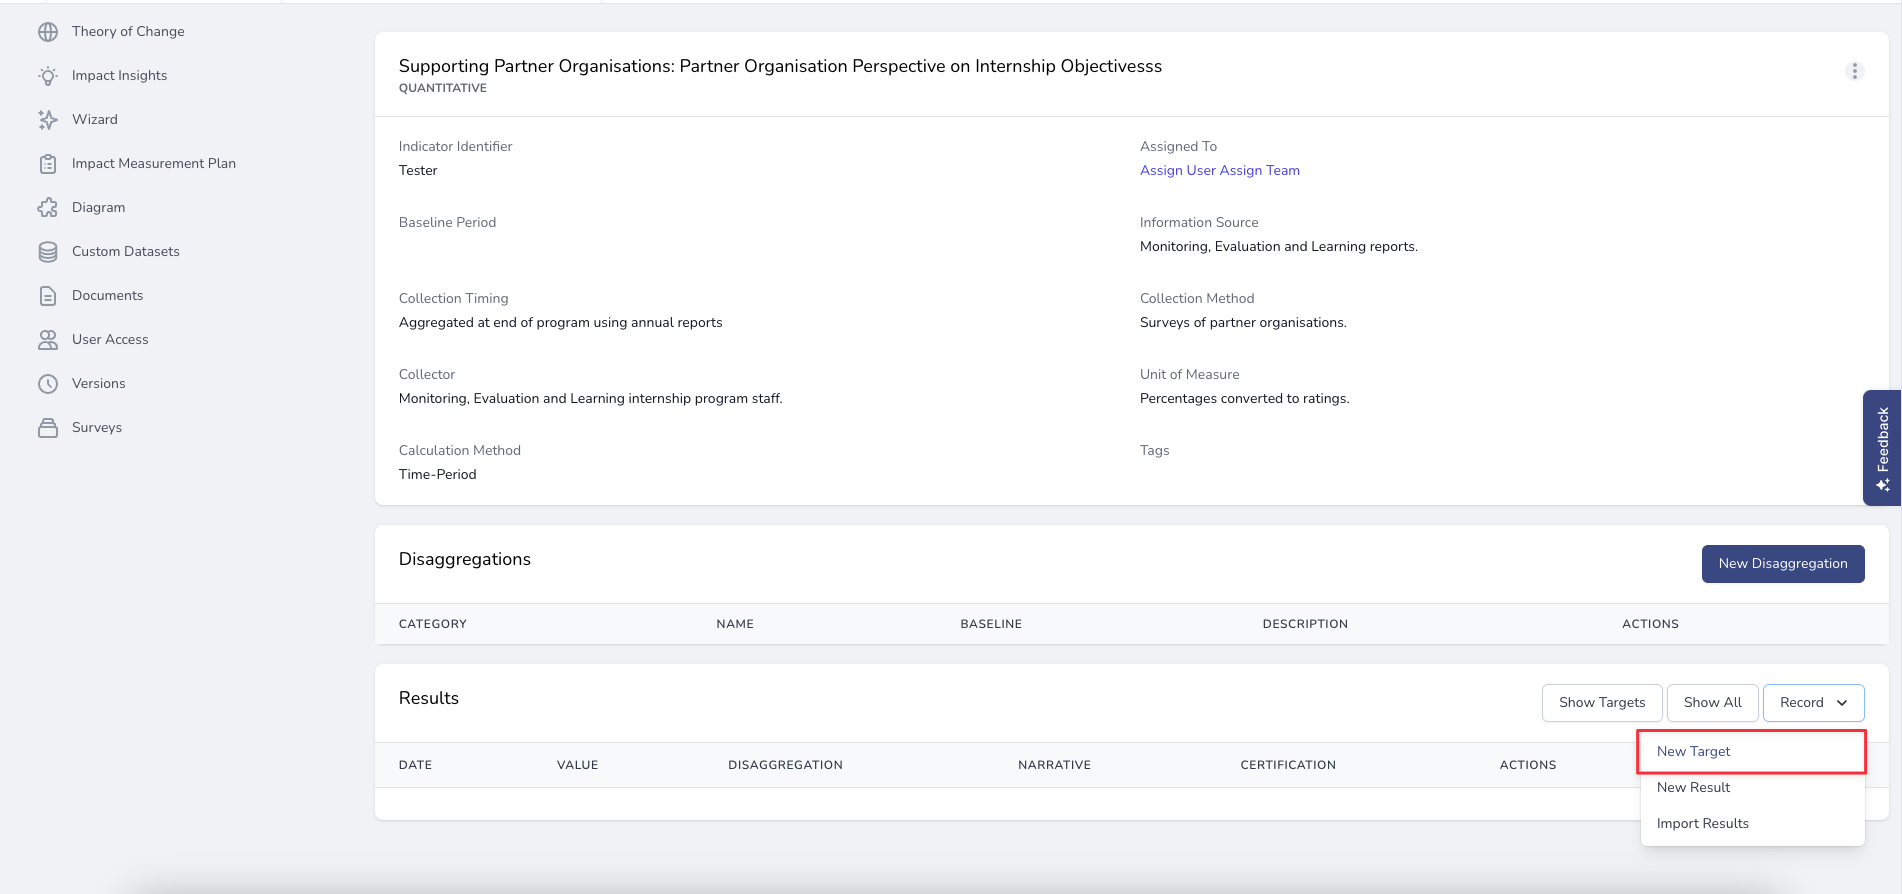
Step 1: Open the first indicator that you want to setup targets for. Targets are most useful for Quantitative indicators.
Step 2: Scroll down to the Results panel and click Record, New Target.
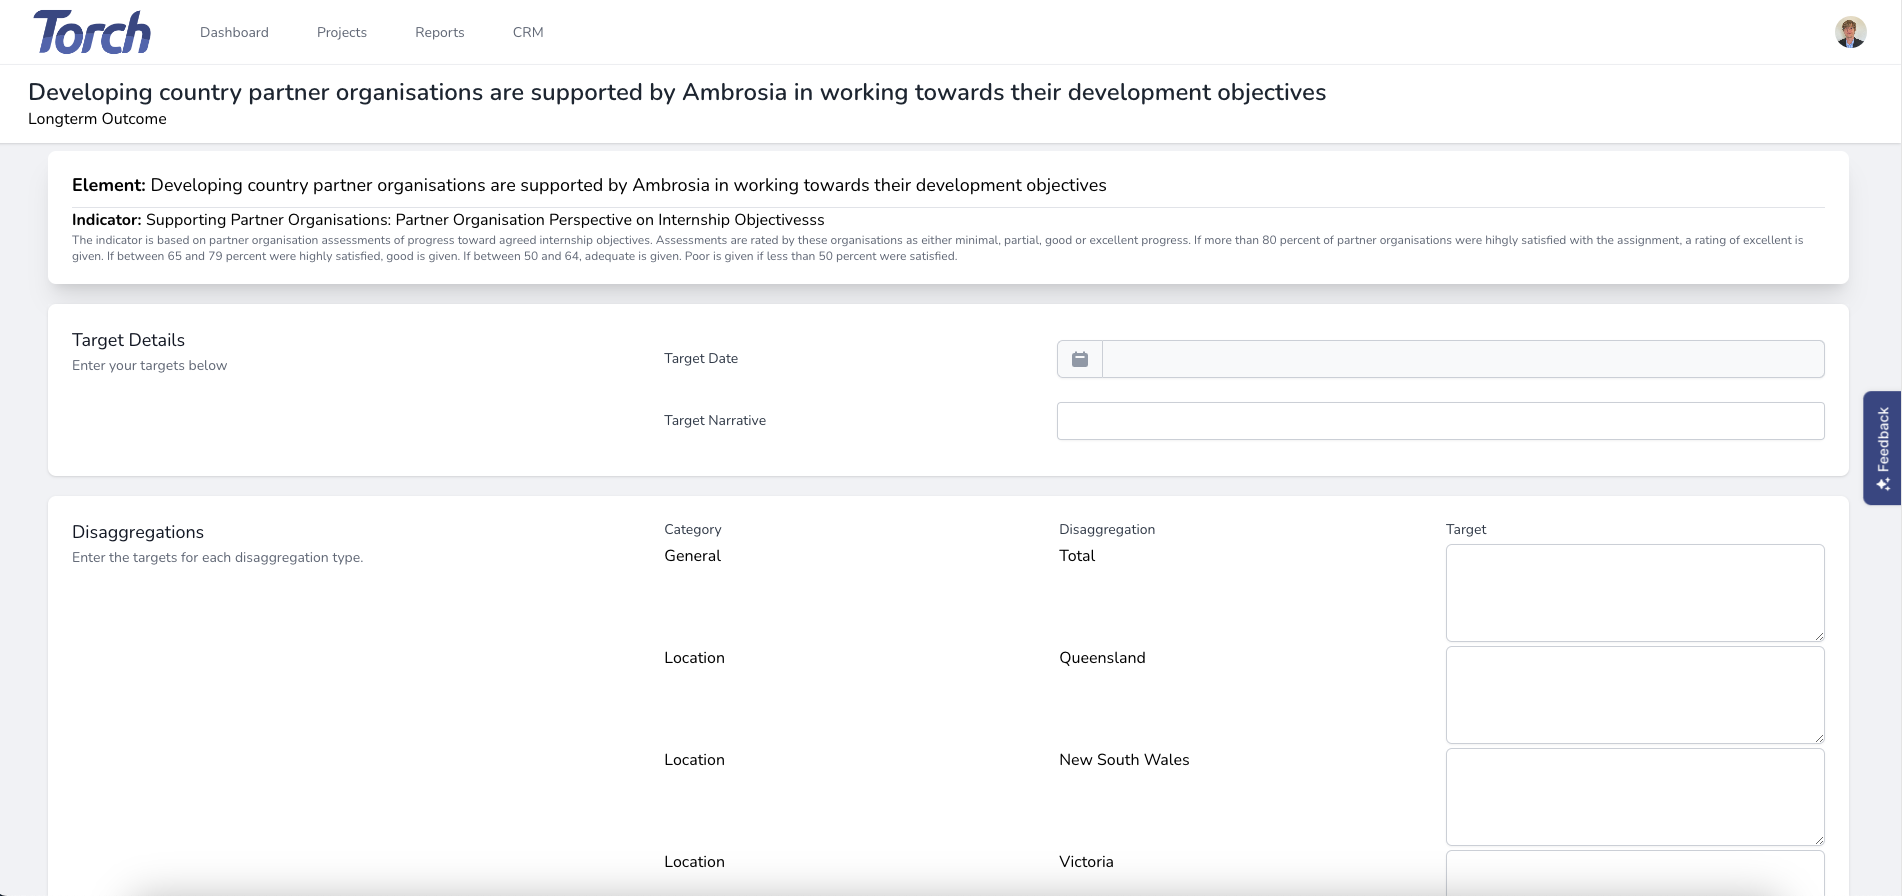
Step 3: Enter a date and any relevant narrative. Enter target values for all of the disaggregations and click Create.
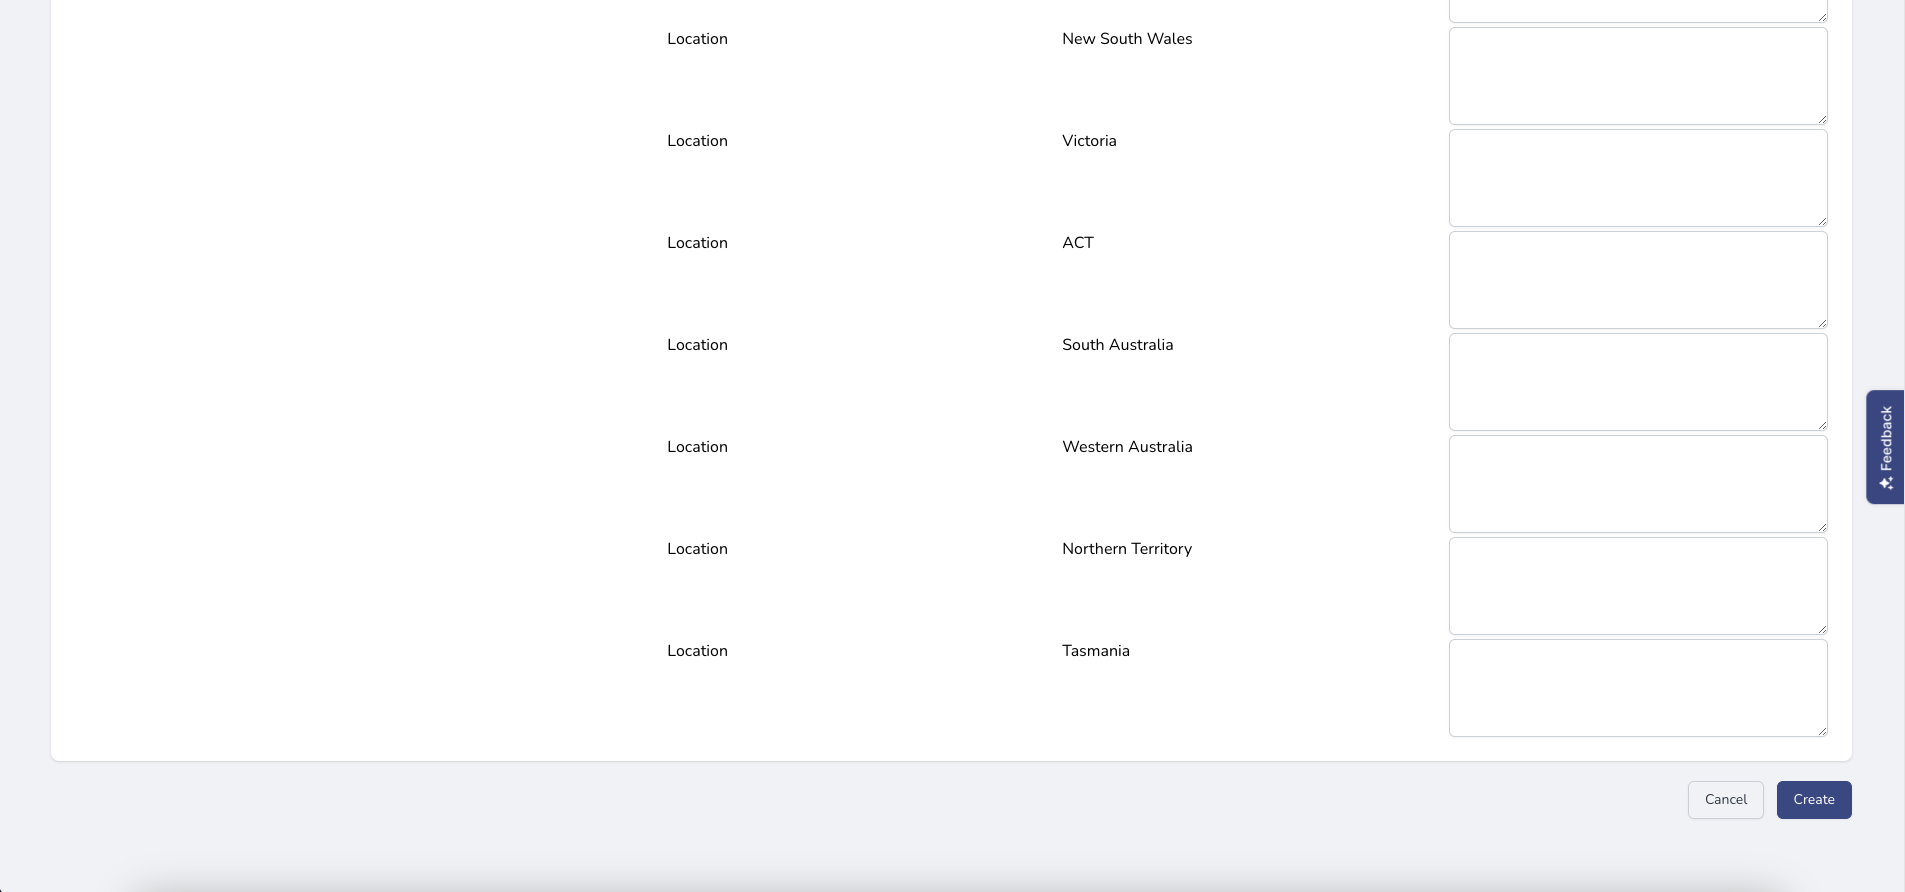
{primary} Targets can be tracked in visualisations within Impact Insights or the tenant wide dashboards.
Recording your first results
Step 1: Open the first indicator that you want to record results for.
Step 2: Scroll down to the Results panel and click Record, New Result.
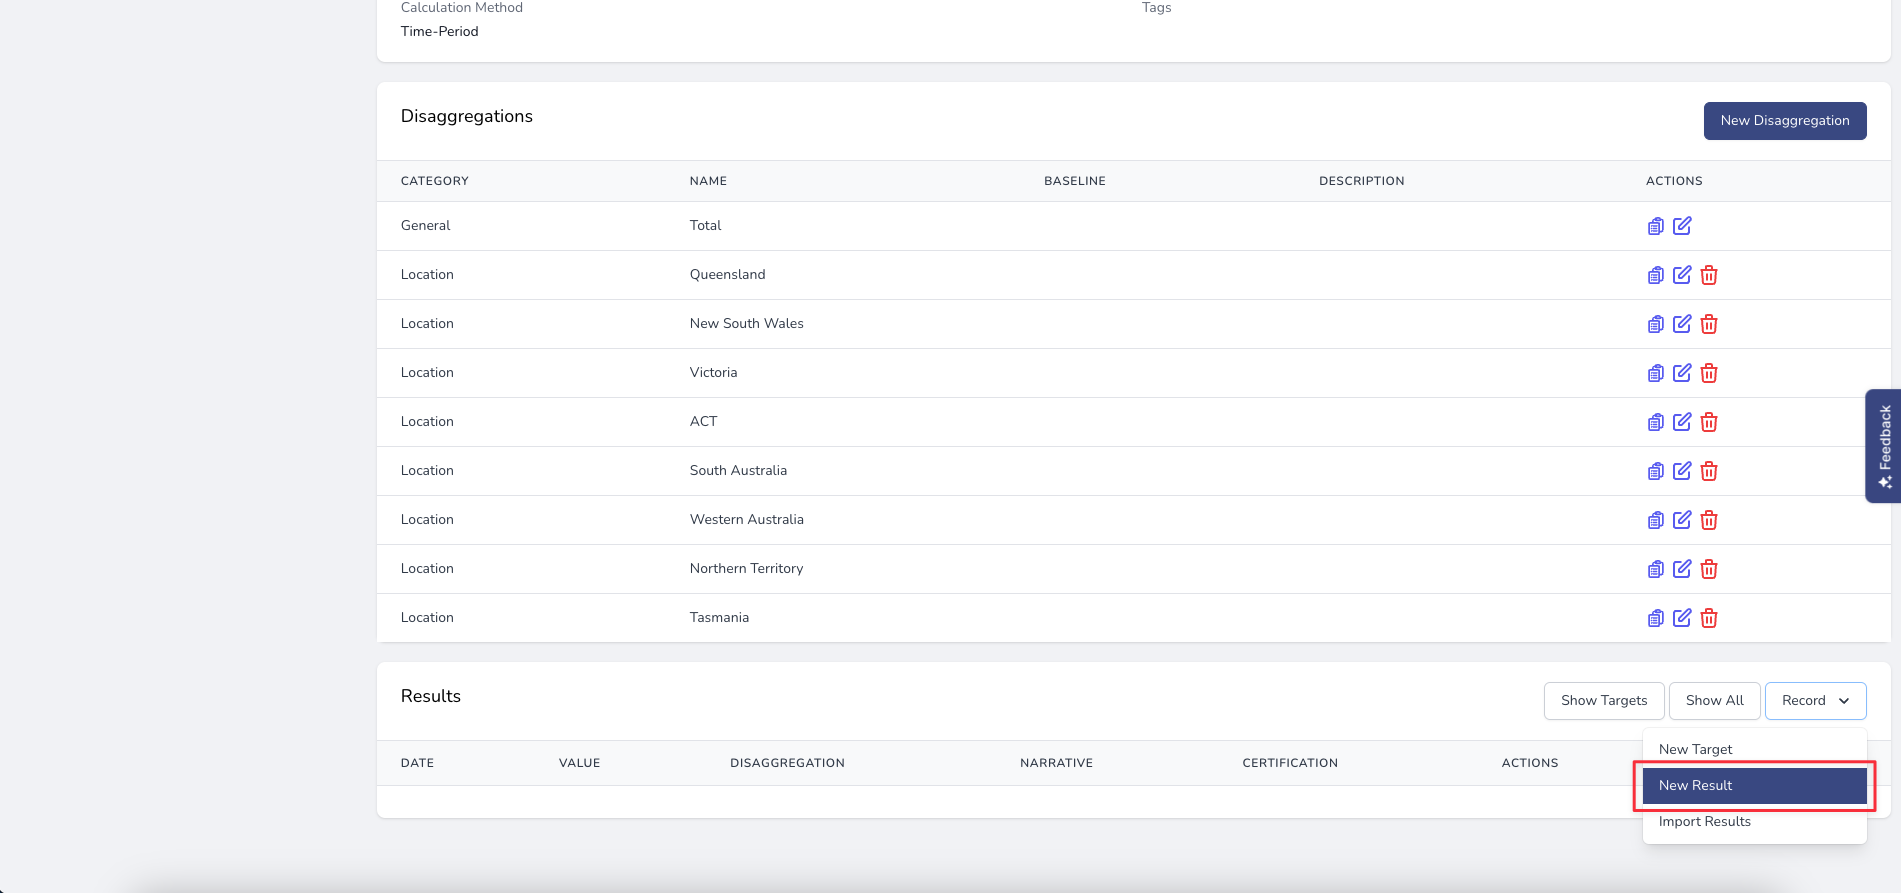
Step 3: Enter a date and select the relevant target if required.
{primary} When selecting a related target, the disaggregation will automatically match up based on the date you select. i.e. if you select the Total disaggregation and have targets and results for multiple disaggregations, it will automatically link the matching disaggregation option.


Step 4: Enter results for each disaggregation and click create.
{primary} Results can be certified by adminstrators of the specific project that the results are related to.